

This article describes how to enable Eureka as a service discovery in the API gateway Apache APISIX and how to use diagnostic tools to find problems in the link.
In microservices architecture, large and complex systems are vertically divided into smaller subsystems based on function or business requirements, which exist as independently deployed sub-processes that communicate with each other through network calls. How these independently deployed services discover each other is the first problem to be solved, so there is often a centralized registry in microservice architectures.
As the most core development framework in the Java ecosystem, Spring continues to liberate the productivity of Java developers from Spring MVC to Spring Boot, and Spring Cloud is Spring's answer to the micro-service architecture in the Cloud native era.
In Spring Cloud, Eureka acts as a registry. Eureka is an open source Registry service written in the Java language by Netflix that plays a key role in Netflix's infrastructure.
Apache APISIX is a dynamic, real-time, high-performance API gateway that provides rich traffic management features such as load balancing, dynamic upstream, canary release, circuit breaking, authentication, observability, and more. As an industry-leading microservice gateway, Apache APISIX provides native support for Eureka. This article will use the Spring Cloud demo project as an example to show you the main functions and features of Apache APISIX docking Eureka service discovery.
Preparation Phase#
This demonstration uses the official spring-cloud-netflix tutorial provided by Spring as an example, which provides the Eureka Server started with SpringBoot as the registration center of Spring Cloud. We also use the same method to start the Eureka server for demonstration. Please visit spring-cloud-samples/eureka for the project address.
The following will introduce you to the relevant code and startup method.
Eureka Server#
Spring Cloud provides an EnableEurekaServer annotation for Eureka, which can directly start an Eureka Server in the way of Spring Boot.
The code example is as follows:
@SpringBootApplication@EnableEurekaServerpublic class EurekaApplication { public static void main(String[] args) { SpringApplication.run(EurekaApplication.class,args); }}The startup method can directly refer to the following code:
git clone git@github.com:spring-cloud-samples/eureka.git# Execute in the project root directory./gradlew bootRunThe application.yml file in the resources directory defines the Eureka Server listening on port 8761.
server: port: 8761Access the HTTP Service of Eureka Client#
The client annotation corresponding to EnableEurekaServer is EnableEurekaClient. Using EnableEurekaClient can easily register an HTTP application started with Spring Boot to Eureka.
The code example is as follows:
@SpringBootApplication@EnableEurekaClient@RestControllerpublic class Application {
        @Value("${server.port}")        int serverPort;
        @RequestMapping("/")        public String home() {                return String.format("server-%s",serverPort);        }
        public static void main(String[] args) {                new SpringApplicationBuilder(Application.class).web(WebApplicationType.SERVLET).run(args);        }
}Here we expose an HTTP service on the / path and return the port currently used by Spring Boot, so that we can use different configuration files to start multiple instances to demonstrate the effect of APISIX on load balancing the list of server instances registered with Eureka.
The configuration file is as follows:
spring.application.name=a-bootiful-client # will be used as the application name registered in Eurekaserver.port=8080 # Modify Modify the listening port to start multiple instancesSet the listening ports to 8080, 8081, and 8082, and start three Spring Boot instances. After completion, use a browser to access port 8761 of Eureka Server to view the results of service registration.
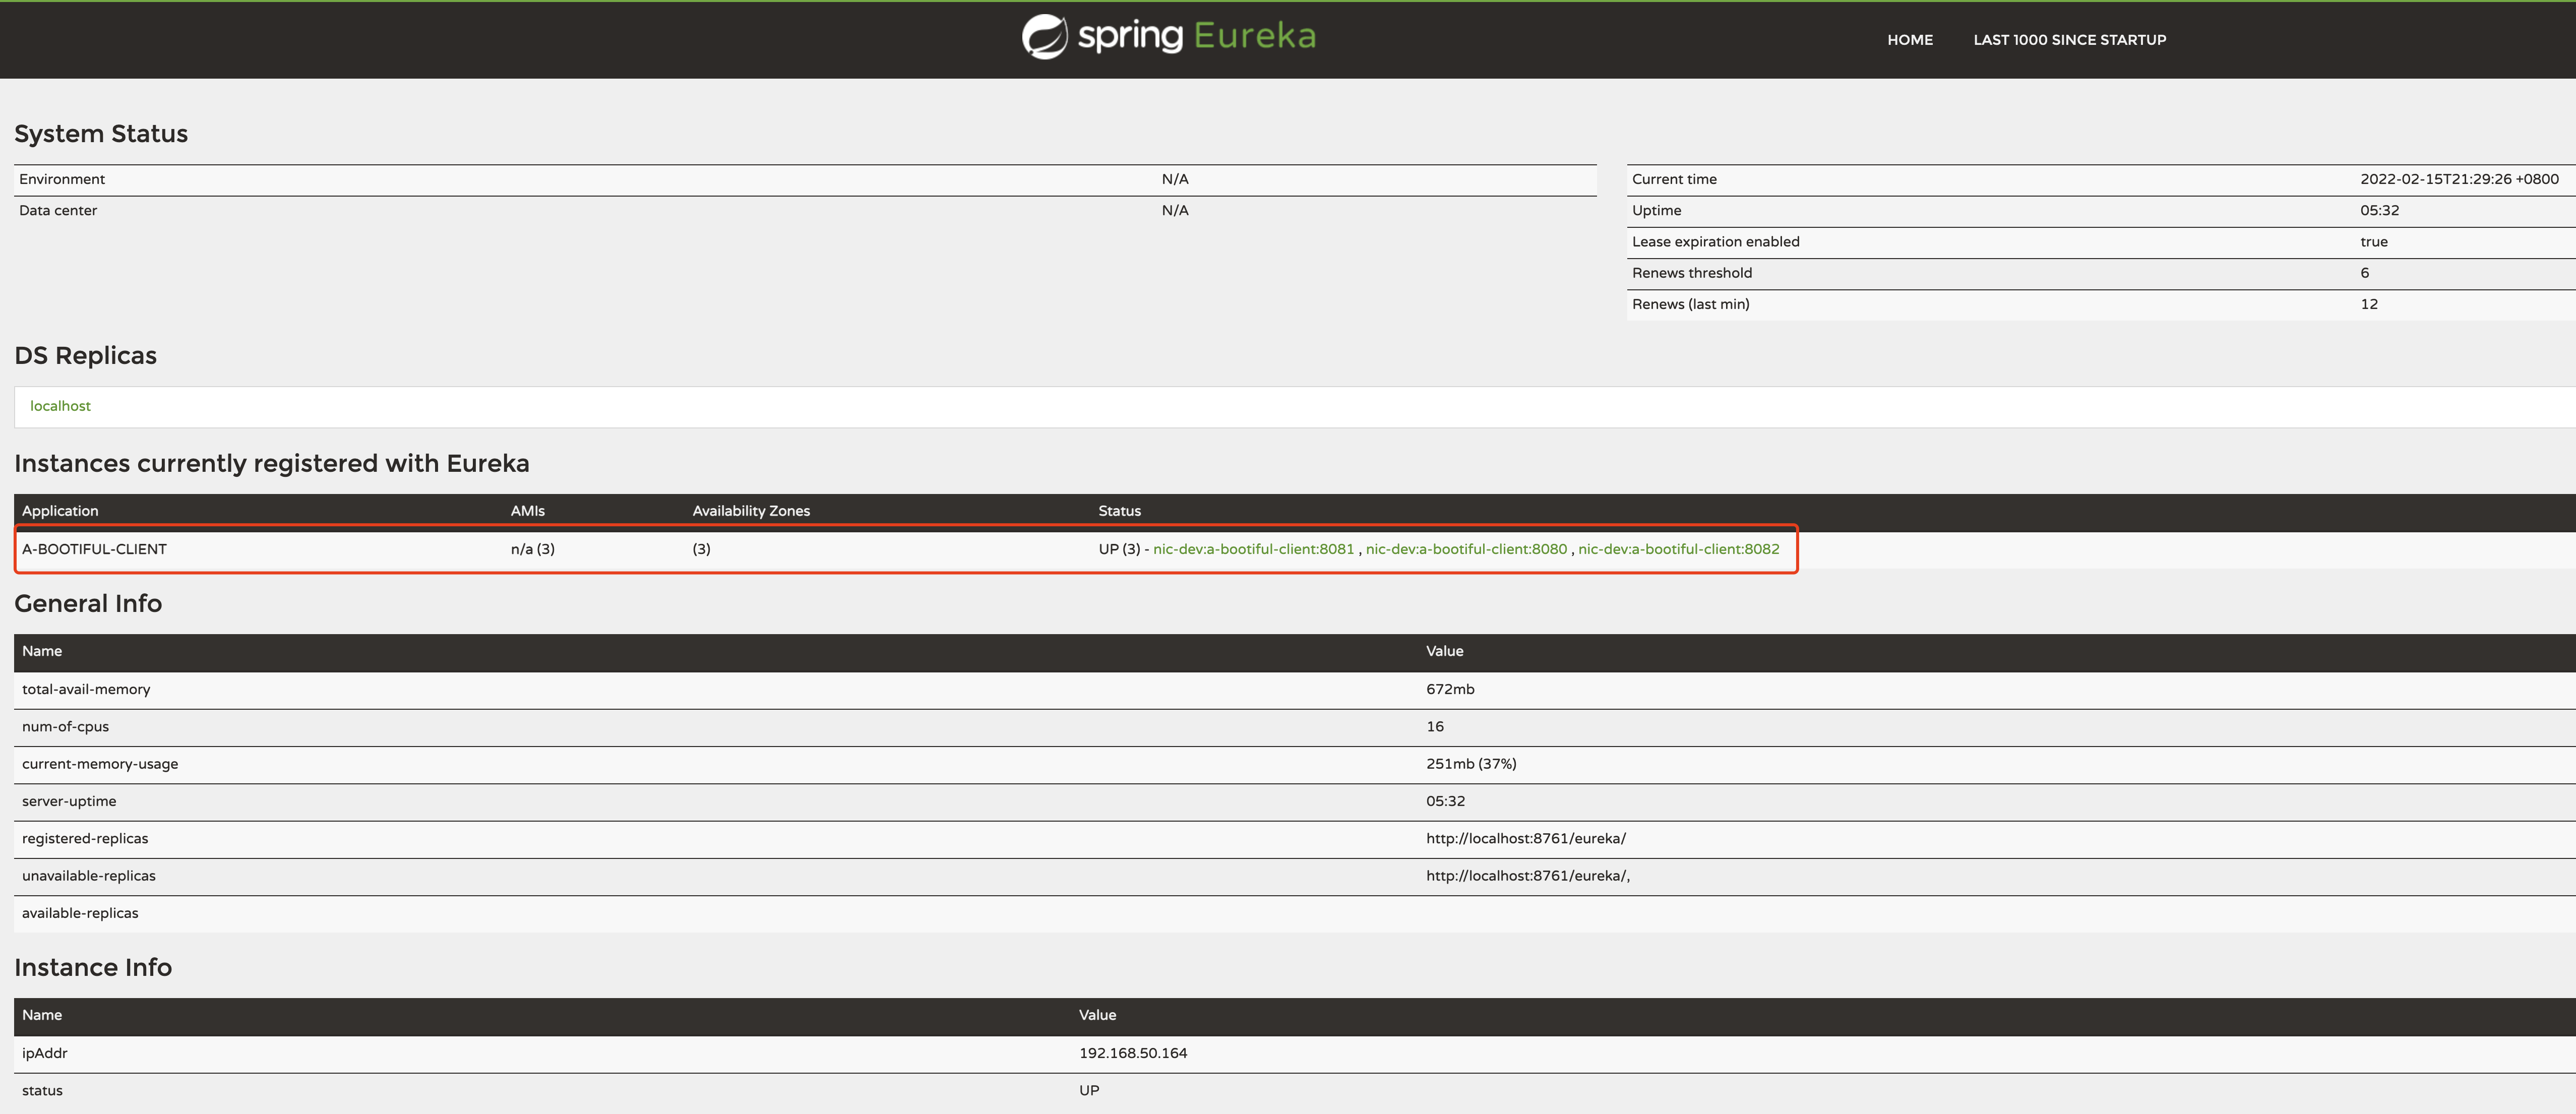
You can see that three instances are registered under the application A-BOOTIFUL-CLIENT, exposing ports 8080, 8081, and 8082, and they are all in the UP state.
Proxying SpringCloud Applications using APISIX#
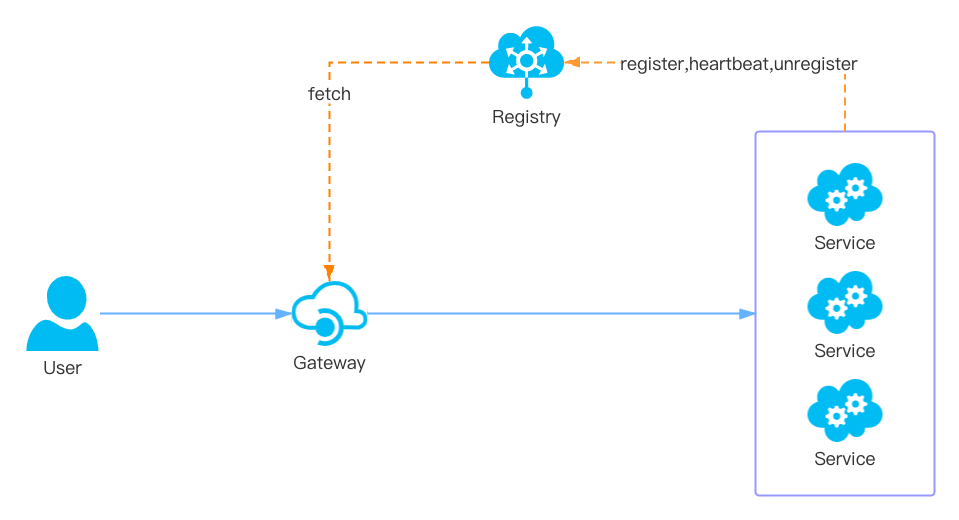
Next, we will implement the request chain as shown in the following figure:
Start Apache APISIX#
First, you need to find apisix.discovery in the configuration file config.yaml of Apache APISIX, modify the related configuration of Eureka Server connection information, and finally start APISIX.
discovery: # service discovery center eureka: host: # it's possible to define multiple eureka hosts addresses of the same eureka cluster. - "http://172.23.79.129:8761" # Access address of Eureka Server started by Spring Boot prefix: /eureka/ fetch_interval: 30 # default 30s weight: 100 # default weight for node timeout: connect: 2000 # default 2000ms send: 2000 # default 2000ms read: 5000 # default 5000ms
Create and Configure a Route#
Create a Route and enable the Eureka Service Discovery plugin in Upstream.
upstream.discovery_typeiseureka.upstream.service_nameis the application nameA-BOOTIFUL-CLIENTregistered in Eureka.
curl http://172.30.45.72:9180/apisix/admin/routes/1 \-H 'X-API-KEY: edd1c9f034335f136f87ad84b625c8f1' -X PUT -i -d ' "uri": "/*", "host": "eureka-demo", "upstream": { "service_name": "A-BOOTIFUL-CLIENT", "type": "roundrobin", "discovery_type": "eureka" }}'Request Routing#
Use the curl command to make multiple requests to verify the load balance effect.
$ curl http://172.30.45.72:9080/ -H "Host: eureka-demo"server-8081%$ curl http://172.30.45.72:9080/ -H "Host: eureka-demo"server-8080%$ curl http://172.30.45.72:9080/ -H "Host: eureka-demo"server-8082%$ curl http://172.30.45.72:9080/ -H "Host: eureka-demo"server-8081%$ curl http://172.30.45.72:9080/ -H "Host: eureka-demo"server-8080%$ curl http://172.30.45.72:9080/ -H "Host: eureka-demo"server-8082%From the above returned results, you can see that requests are allocated to the three instances registered in Eureka in turn. This is because the load balancing algorithm we use is roundrobin, and all backend instances will be allocated requests in turn.
Simulate Instance Downtime#
Stop the 8081 instance, simulate the downtime of the instance, and observe the effect of the request.
$ while true; do curl http://172.30.45.72:9080/ -H "Host: eureka-demo"; echo; sleep 1; done
server-8080server-8082server-8081
server-8080server-8082server-8081
server-8080server-8082
server-8080server-8082It can be seen from the above results that after closing the 8081 instance, Apache APISIX will synchronize to the latest instance list of Eureka in time, and then forward the request to the correct backend.
Diagnostic Tools#
In microservice systems, unexpected forwarding problems are often encountered. The reasons for these problems may come from various links in service discovery, such as: client registration exception, registration center data exception, gateway reading registration data exception, etc., diagnostic tools that can be used in the link when an anomaly occurs will be particularly important.
Therefore, APISIX provides a diagnostic interface in the Service Discovery plugin, which can easily query the list of services currently being used by the gateway. Combined with the console of the registry, we can quickly diagnose the link from the gateway to the registry.
The diagnostic interface is exposed on port 9090 of the loopback interface by default, and the access method is GET /v1/discovery/{discovery_type}/dump, for example:
curl http://localhost:9090/v1/discovery/eureka/dump
{ "services": { "A-BOOTIFUL-CLIENT": [ { "weight": 100, "metadata": { "management.port": "8081" }, "host": "192.168.50.164", "port": 8081 }, { "weight": 100, "metadata": { "management.port": "8080" }, "host": "192.168.50.164", "port": 8080 }, { "weight": 100, "metadata": { "management.port": "8082" }, "host": "192.168.50.164", "port": 8082 } ] }, "config": { "prefix": "\/eureka\/", "timeout": { "connect": 2000, "send": 2000, "read": 5000 }, "fetch_interval": 30, "host": [ "http:\/\/172.23.79.129:8761" ], "weight": 100 }}In this way, the Eureka data that APISIX is using is queried.
Summary#
Spring Cloud is a popular microservice framework, and Apache APISIX provides the ability to handle Spring Cloud application traffic by supporting Eureka Service Discovery. We can see that the close integration of these two ecosystems makes the implementation of the microservice architecture change. It is simpler and more efficient, so that business development can focus more on business value.
For more instructions and complete configuration information about the eureka plugin, please refer to the Apache APISIX official documentation.
Apache APISIX is also currently working on additional plugins to support the integration of additional services, so if you are interested, feel free to start a discussion in GitHub Discussion, or via the mailing list to communicate.