

Apache APISIX has been providing support for Apache Kafka since version 1.2 with the
kafka-loggerplugin release.kafka-loggerhas been enhanced several times since then to provide very mature and complete functionality. It supports pushing API request logs, request bodies, and response bodies, to a Kafka cluster in JSON format.
Apache Kafka is an open source stream processing platform managed by Apache, written in Scala and Java. Apache Kafka provides uniformed, high-throughput, low-latency functionality for real-time data processing.
Apache Kafka's persistence layer is essentially a "massive publish/subscribe message queue following a distributed transaction logging architecture," making it valuable as an enterprise-class infrastructure for processing streaming data. It is used by thousands of companies for high-performance data pipelines, streaming analytics, data integration, and mission-critical applications.
Implementation: kafka-logger#
Apache APISIX has been providing support for Apache Kafka since version 1.2 with the kafka-logger plugin release. kafka-logger has been enhanced several times since then to provide very mature and complete functionality. It supports pushing API request logs, request bodies, and response bodies, to a Kafka cluster in JSON format.
When using kafka-logger, users can send a wide range of data and customize the format of the logs sent. kafka-logger supports sending logs in a packaged manner in a batch or for automatic retries.
How to use#
Step 1: Start Kafka Cluster#
This article only demonstrates one way to start the cluster. Please refer to the official documentation for details of other ways to start the cluster.
# Start a cluster with 1 ZooKeeper node and 3 kafka nodes using docker-compose# At the same time, an EFAK is started for data monitoring.version: '3'
services:  zookeeper:    image: confluentinc/cp-zookeeper:6.2.1    hostname: zookeeper    ports:      - "2181:2181"    environment:      ZOOKEEPER_CLIENT_PORT: 2181      ZOOKEEPER_SERVER_ID: 1      ZOOKEEPER_SERVERS: zookeeper:2888:3888
  kafka1:    image: confluentinc/cp-kafka:6.2.1    hostname: kafka1    ports:      - "9092:9092"    environment:      KAFKA_ADVERTISED_LISTENERS: LISTENER_DOCKER_INTERNAL://kafka1:19092,LISTENER_DOCKER_EXTERNAL://${DOCKER_HOST_IP:-127.0.0.1}:9092      KAFKA_LISTENER_SECURITY_PROTOCOL_MAP: LISTENER_DOCKER_INTERNAL:PLAINTEXT,LISTENER_DOCKER_EXTERNAL:PLAINTEXT      KAFKA_INTER_BROKER_LISTENER_NAME: LISTENER_DOCKER_INTERNAL      KAFKA_ZOOKEEPER_CONNECT: "zookeeper:2181"      KAFKA_BROKER_ID: 1      KAFKA_LOG4J_LOGGERS: "kafka.controller=INFO,kafka.producer.async.DefaultEventHandler=INFO,state.change.logger=INFO"    depends_on:      - zookeeper
  kafka2:    image: confluentinc/cp-kafka:6.2.1    hostname: kafka2    ports:      - "9093:9093"    environment:      KAFKA_ADVERTISED_LISTENERS: LISTENER_DOCKER_INTERNAL://kafka2:19093,LISTENER_DOCKER_EXTERNAL://${DOCKER_HOST_IP:-127.0.0.1}:9093      KAFKA_LISTENER_SECURITY_PROTOCOL_MAP: LISTENER_DOCKER_INTERNAL:PLAINTEXT,LISTENER_DOCKER_EXTERNAL:PLAINTEXT      KAFKA_INTER_BROKER_LISTENER_NAME: LISTENER_DOCKER_INTERNAL      KAFKA_ZOOKEEPER_CONNECT: "zookeeper:2181"      KAFKA_BROKER_ID: 2      KAFKA_LOG4J_LOGGERS: "kafka.controller=INFO,kafka.producer.async.DefaultEventHandler=INFO,state.change.logger=INFO"    depends_on:      - zookeeper

  kafka3:    image: confluentinc/cp-kafka:6.2.1    hostname: kafka3    ports:      - "9094:9094"    environment:      KAFKA_ADVERTISED_LISTENERS: LISTENER_DOCKER_INTERNAL://kafka3:19094,LISTENER_DOCKER_EXTERNAL://${DOCKER_HOST_IP:-127.0.0.1}:9094      KAFKA_LISTENER_SECURITY_PROTOCOL_MAP: LISTENER_DOCKER_INTERNAL:PLAINTEXT,LISTENER_DOCKER_EXTERNAL:PLAINTEXT      KAFKA_INTER_BROKER_LISTENER_NAME: LISTENER_DOCKER_INTERNAL      KAFKA_ZOOKEEPER_CONNECT: "zookeeper:2181"      KAFKA_BROKER_ID: 3      KAFKA_LOG4J_LOGGERS: "kafka.controller=INFO,kafka.producer.async.DefaultEventHandler=INFO,state.change.logger=INFO"    depends_on:      - zookeeper
efak: image: nickzurich/kafka-eagle:2.0.9 hostname: efak ports: - "8048:8048" depends_on: - kafka1 - kafka2 - kafka3Step 2: Create Topic#
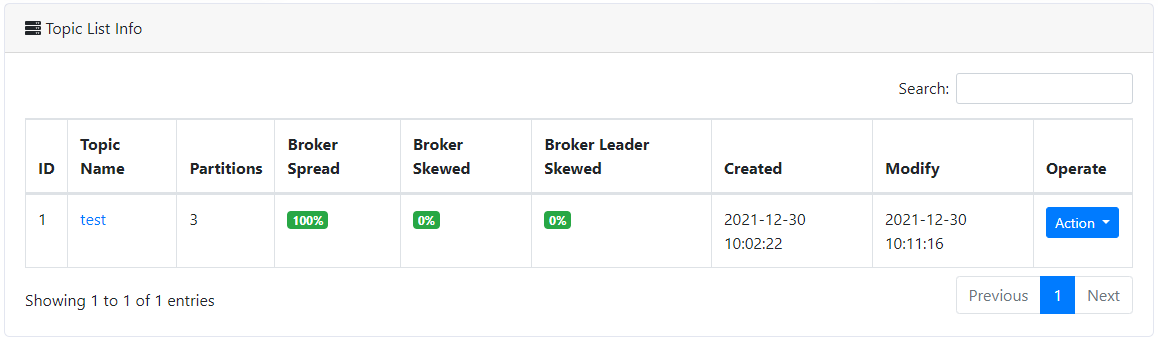
Next we create the test Topic to collect logs.
Step 3: Create Routing and Enable Plugin#
The following commands allow you to create routes and enable the kafka-logger plugin.
curl -XPUT 'http://127.0.0.1:9080/apisix/admin/routes/r1' \--header 'X-API-KEY: edd1c9f034335f136f87ad84b625c8f1' \--header 'Content-Type: application/json' \--data-raw '{ "uri": "/*", "plugins": { "kafka-logger": { "batch_max_size": 1, "broker_list": { "127.0.0.1": 9092 }, "disable": false, "kafka_topic": "test", "producer_type": "sync" } }, "upstream": { "nodes": { "httpbin.org:80": 1 }, "type": "roundrobin" }}'The above code configures the kafka broker address, the target Topic, the production mode for synchronization, and the maximum number of logs to be included in each batch. Here we can start by setting batch_max_size to 1, i.e. write one message to Kafka for every log produced.
With the above settings, it is possible to send the logs of API requests under the /* path to Kafka.
Step 4: Send Requests#
Next, we send some requests through the API and record the number of requests.
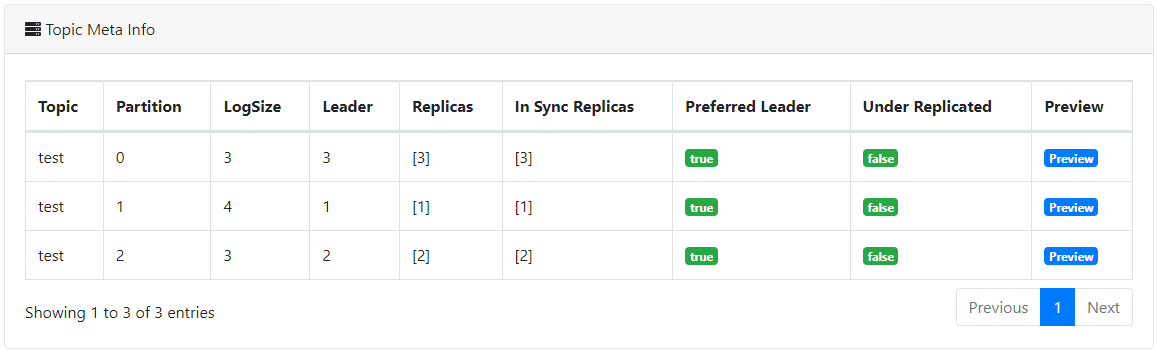
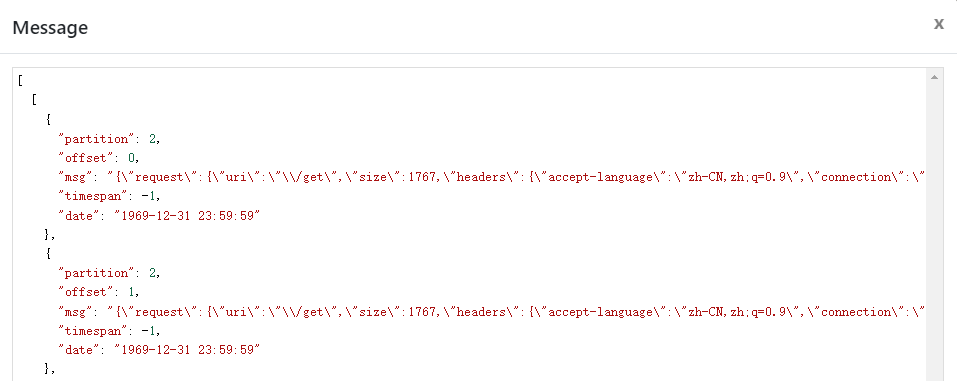
# Send 10 requests to APIcurl http://127.0.0.1:9080/getAs you can see in the figure below, some log messages have been written to the test topic we created. If you click to view the log content, you can see that the logs of the API requests made above have been written.
Customize the logging structure#
Of course, we can also set the structure of the log data sent to Kafka during use through the metadata configuration provided by the kafka-logger plugin. By setting the log_format data, you can control the type of data sent.
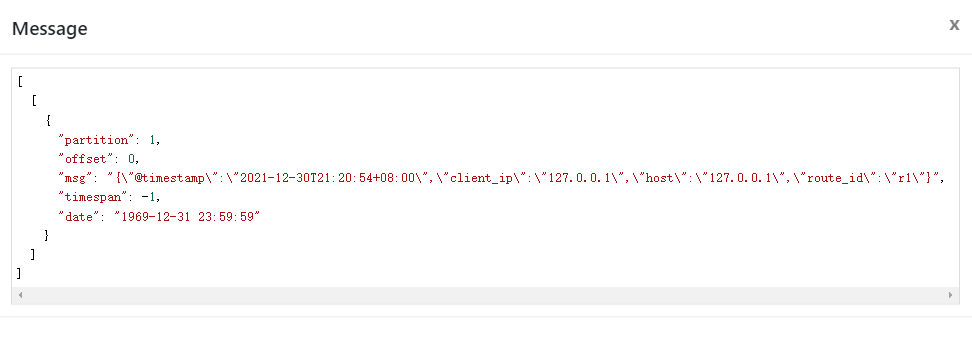
For example, $host and $time_iso8601 in the following data are built-in variables provided by Nginx; APISIX variables such as $route_id and $service_id are also supported.
curl -XPUT 'http://127.0.0.1:9080/apisix/admin/plugin_metadata/kafka-logger' \--header 'X-API-KEY: edd1c9f034335f136f87ad84b625c8f1' \--header 'Content-Type: application/json' \--data-raw '{ "log_format": { "host": "$host", "@timestamp": "$time_iso8601", "client_ip": "$remote_addr", "route_id": "$route_id" }}'A simple test by sending a request shows that the above logging structure settings have taken effect. Currently, Apache APISIX provides a variety of log format templates, which provides great flexibility in configuration, and more details on log format can be found in Apache APISIX documentation.
Turn off the plugin#
If you are done using the plugin, simply remove the kafka-logger plugin-related configuration from the route configuration and save it to turn off the plugin on the route. Thanks to the dynamic advantage of Apache APISIX, the process of turning on and off the plugin does not require restarting Apache APISIX, which is very convenient.
curl http://127.0.0.1:9080/apisix/admin/routes/1 -H 'X-API-KEY: edd1c9f034335f136f87ad84b625c8f1' -X PUT -d '{ "methods": ["GET"], "uri": "/hello", "plugins": {}, "upstream": { "type": "roundrobin", "nodes": { "127.0.0.1:1980": 1 } }}'Summary#
In this article, we have introduced the feature preview and usage steps of the kafka-logger plugin. For more information about the kafka-logger plugin and the full configuration list, you can refer to the official documentation.
We are also currently working on other logging plugins to integrate with more related services. If you're interested in such integration projects, feel free to start a discussion in GitHub Discussions or communicate via the mailing list.