This article shares solutions and practices for observability in the context of Nginx observability, the relationship between Apache APISIX and Nginx, Apache APISIX observability, and further enhancing observability in conjunction with Apache SkyWalking.
Overview#
"Observability" is a metric that allows you to keep track of how your infrastructure, system platform, or application is performing. Commonly, metrics, logging, and tracing and events data are collected to help developers and operations staff detect, investigate, alert, and correct system problems.
In this article, we will share solutions and practices for observability in the context of Nginx observability, the relationship between Apache APISIX and Nginx, Apache APISIX observability, and further observability improvements in conjunction with Apache SkyWalking.
Nginx Observability#
Common monitoring methods for Nginx#
Nginx is observable to some extent, and the following is a list of common monitoring methods for Nginx.
- ngx_http_stub_status_module
- VTS module + exporter + prometheus + grafana (if you have a low version of Nginx, you need to introduce exporter)
- Nginx Amplify SaaS
ngx_http_stub_status_module#
The ngx_http_stub_status_module mainly collects instance-level statistics.
VTS module#
The VTS module has 3 obvious drawbacks.
Complex installation: Although VTS module is able to collect metrics and collect more types of metrics, it is more complex to install. If you want to use the VTS module, you need to recompile Nginx, add the VTS moudle before compiling Nginx, and reinstall Nginx after completing the compilation before you can use VTS properly. 2.
Weak extensibility: VTS extensibility is divided into two parts: one is to add extensions to VTS before compilation; the other is to add extensions after compilation -- modifying the nginx.conf configuration file. Adding extensions by modifying the nginx.conf file will cause Nginx to reload, and a direct reload of the production environment may have some impact on the business.
Slow community updates: The last update to the VTS module was in 2018, and it has been down for 3 years.
Nginx Amplify SaaS#
Nginx Amplify is a SaaS service where Nginx Amplify provides services on the remote end and installs agents outside of the Nginx service. If you install the collection module outside of Nginx, you are limited in the metrics you can collect, and you can only get the information exposed by Nginx, not the internal information that is not exposed.
In addition, because Nginx Amplify SaaS is a SaaS service, you need to transfer the collected data to the server through the public network, which can pose some security risks and keep some enterprise users out. Perhaps Nginx Amplify is targeted at enterprise users like Nginx plus, not open source users.
Also, the Nginx Amplify SaaS community is not active and has been down for 2 years.
Nginx's pitfalls#
Nginx has its own flaws in Events collection, two of which are listed here.
Nginx is configured based on nginx.conf, which is reloaded after changes are made to the nginx.conf file. There are no Events available other than reload events, so we can't know what has changed each time we modify the file, e.g., if we start with one route and modify the file to add 10 routes, we won't know which 10 routes have been added with only reload events.
Nginx is a reverse proxy, and the real backend service may be restarted, upgraded, or abnormal, so without active health checks and relying on passive checks, we will only know that something is wrong with the service when the traffic is abnormal, which will throw away many Events and result in incomplete information about upstream Events. .
Nginx Observability Summary#
The open source version of Nginx does not provide very good monitoring. Although Nginx provides some monitoring tools, they are very complex to install and configure and have little scalability. It is possible that these tools are not designed for observability, but simply to be able to see metrics or statistics to easily pinpoint problems. There are various observability setup products available, but they are difficult to integrate into Nginx.
In addition, the Nginx community is stagnant, resulting in slow iterations of Nginx.
Apache APISIX Overview#
Apache APISIX in relation to Nginx#
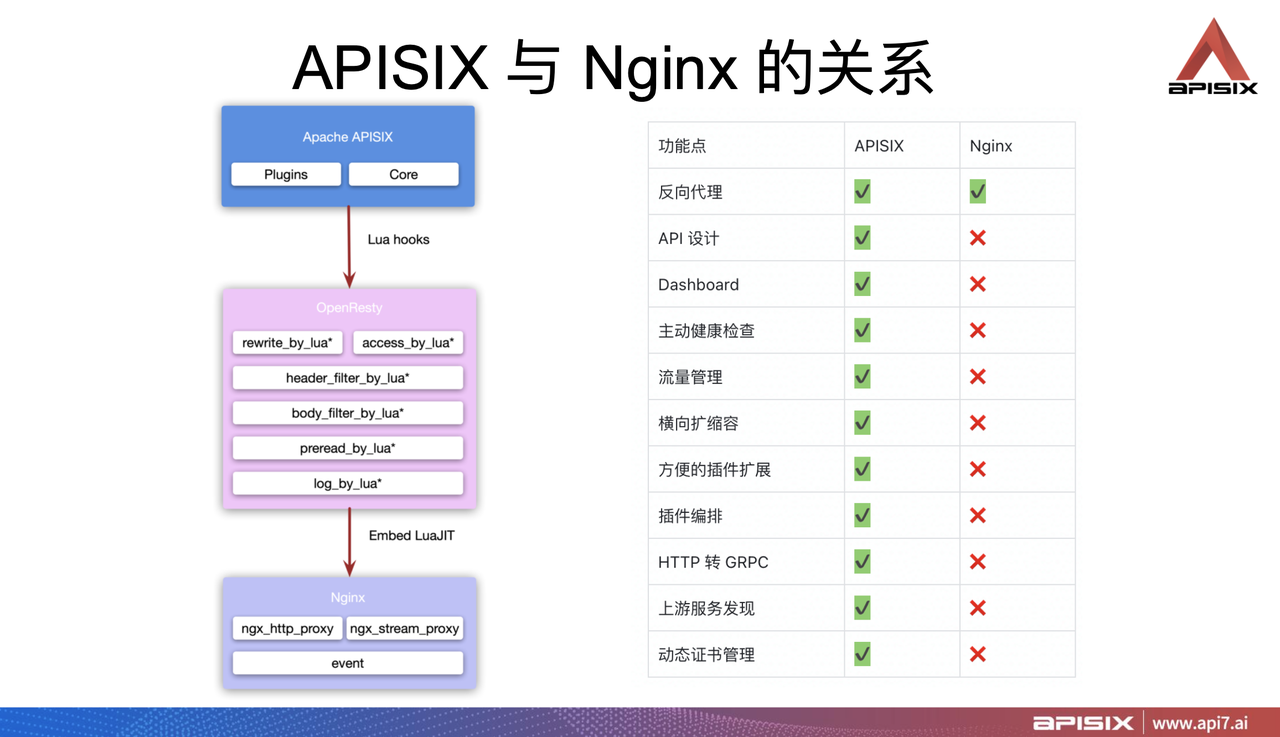
Apache APISIX is based on the Nginx implementation, but relies only on the Nginx network libraries. On top of Nginx, Apache APISIX implements its own core code, with extension mechanisms reserved.
The table shows a comparison of Apache APISIX and Nginx features. Apache APISIX can do both reverse proxy and implement some features that Nginx does not support, such as: active health checking, traffic management, horizontal scaling, etc., and these features are open source.
- API Design: It is simpler to use Apache APISIX for API design.
- Open Source Dashboard: The reverse proxy can be configured all in the interface.
- Active Health Check:Apache APISIX supports active health checks, which can be combined with Events to improve observability.
- Traffic Management: Suitable for monitoring data, or for use when a business release goes live.
- Horizontal Scaling: Apache APISIX supports horizontal scaling, a feature that is made possible by the Apache APISIX architecture (see below).
- Plug-in extension mechanism: Apache APISIX's plug-in extension mechanism makes it extremely powerful and scalable.
- Plugin orchestration: Multiple plugins are logically orchestrated and combined for use according to business requirements.
- Certificate Management: Apache APISIX supports dynamic certificate management.
Apache APISIX Introduction#
Apache APISIX is a dynamic, real-time, high-performance API gateway that provides load balancing, dynamic upstream, canary release, service meltdown, authentication, observability, and other rich traffic management features. Apache APISIX is also the world's most active open source API gateway project, and is a production-ready, high-performance gateway. Hundreds of enterprises around the world have used Apache APISIX to handle business-critical traffic, covering finance, Internet, manufacturing, retail, carriers, and more, such as NASA, the EU's Digital Factory, Air China, China Mobile, Tencent, Huawei, Weibo, NetEase, Shell Finder, 360, Taikang, and more.
Apache APISIX Solution#
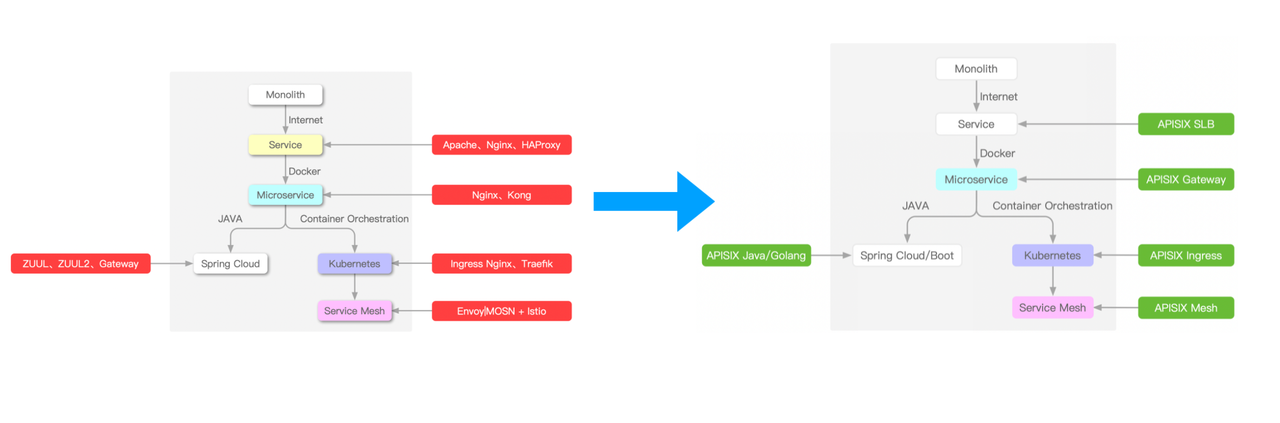
On the left side of the diagram above, the evolution from top to bottom is from monolithic services to SOA (Service Oriented Architecture) to microservices.
Under SOA, gateways typically use Nginx or HAProxy; under microservices architecture, gateways use Nginx for load balancing. There are two common solutions for microservices architecture: one is based on Java technology stack implementation, such as Spring Cloud series; the other is Service Mesh.
Where does Apache APISIX fit into this evolutionary process and what can it do?
Simply put, the parts in red in the diagram on the left (Nginx / HAProxy / Kong / Spring Cloud Zuul / Spring Cloud Gateway / Traefik / Envoy / Ingress Nginx) can all be replaced with an Apache APISIX solution.
In SOA there is Apache APISIX SLB solution, in microservice architecture there is Apache APISIX Gateway, in Kubernetes deployment there is Apache APISIX Ingress, in Service Mesh deployment there is Apache APISIX mesh.
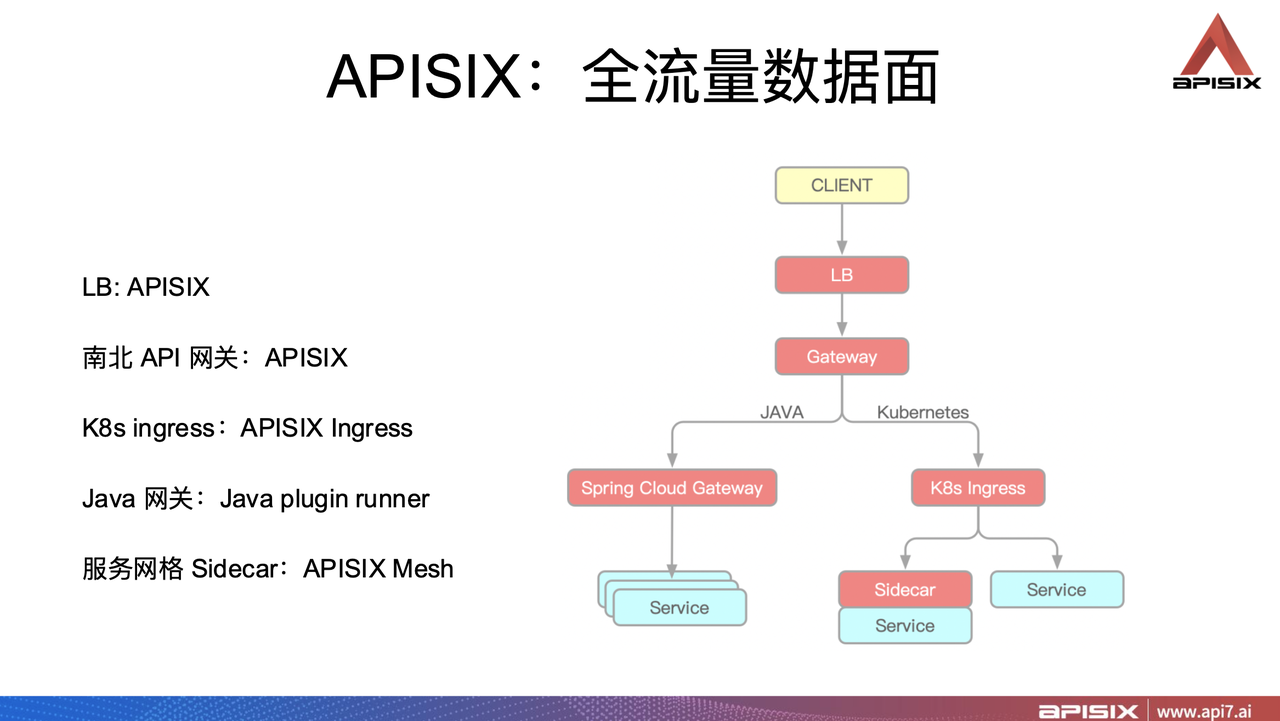
In terms of service request traffic, when a client initiates a request, it passes through the LB, passes through the Gateway, and the request is distributed to the back-end business service. The parts in red (LB / Gateway / Spring Cloud Gateway / K8s Ingress / Sidecar) can all choose Apache APISIX as the solution. Apache APISIX supports multi-language development plug-ins and can be written in Java under the Java architecture.
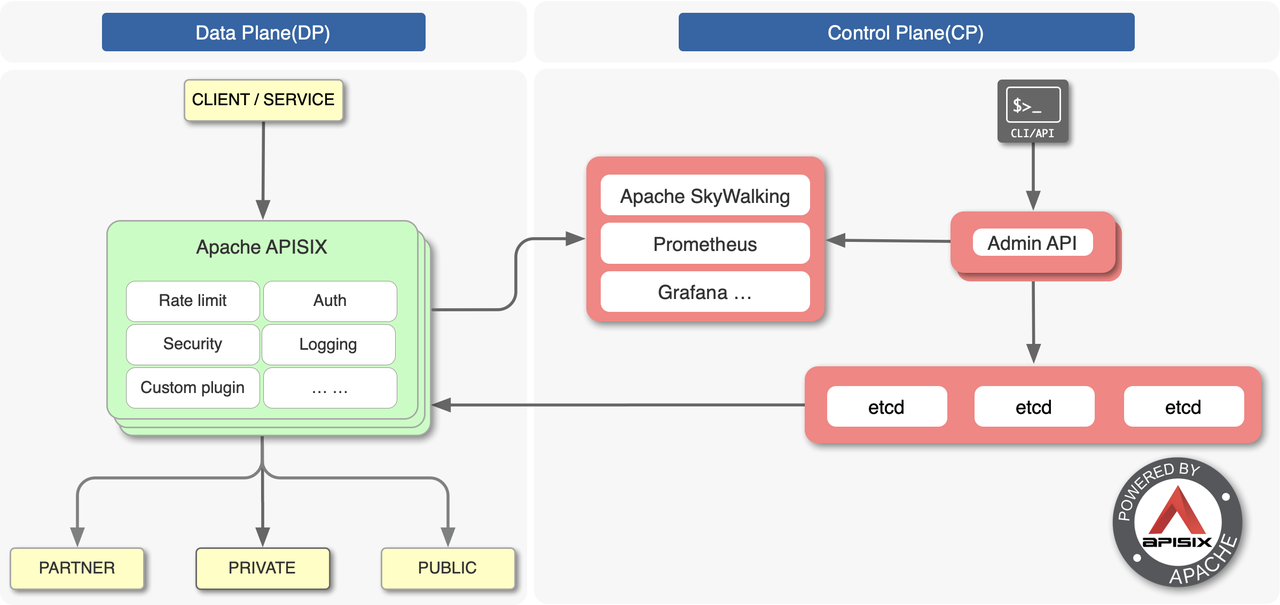
Apache APISIX is a full-flow data plane, and Apache APISIX has solutions for LB, Gateway, Ingress, and sidecar, and they are unified solutions in terms of observability. When the solution is unified, the management control chain is also easy to implement out.
Apache APISIX Observability#
After a brief look at Nginx and Apache APISIX, here are two questions: What can Apache APISIX do in terms of observability, and what are the advantages of Apache APISIX observability?
Types of data Apache APISIX supports to collect#
Apache APISIX supports the following types of data collection.
- Tracing - integrated with SkyWalking
- Metrics - integrated with SkyWalking / Prometheus
- Logging - integration with SkyWalking / other logging platforms
Apache APISIX is a gateway-type product that can replace Nginx or other gateways; in terms of observability Apache APISIX can integrate with multiple APM or observable systems, e.g. Tracing part can integrate with SkyWalking, Metrics can integrate with SkyWalking or Prometheus, Logging can integrate with SkyWalking and other logging systems.
Apache APISIX advantages in observability#
High Scalability#
Why does Apache APISIX have great extensibility? Because Apache APISIX supports writing plug-ins in multiple languages and can write plug-ins in programming languages such as Lua, Java, Golang, etc. Apache APISIX can extend its capabilities through plug-ins. The three data types mentioned above are implemented through the plug-in mechanism.
Flexible Configuration Capabilities#
Three examples are given to illustrate the flexible configuration capabilities of Apache APISIX.
The first example is Apache APISIX can modify the configuration of logging at runtime, for example, by adding or modifying logging fields. Modifying logging fields is a relatively common requirement. For example, when a business first goes live, logging fields are configured, and after the system has been running for a while, several logging fields need to be modified or added. If you are using Nginx, you can do this by modifying the nginx.conf file and reloading the configuration to take effect. Apache APISIX just needs to script the fields to take effect dynamically.
A second example of flexible configuration capabilities is the use of Prometheus. In Apache APISIX, if you want to create/delete a metric or extend metrics labels, just add a new metircs or fill in the relevant information in the Prometheus plugin, and Apache APISIX has a hot reload mechanism to take effect directly without restarting.
The third flexible configuration capability is in the Apache APISIX implementation, which manages all routing objects and has a set of object management mechanisms in memory. In Apache APISIX, you can add a plug-in to an API, and the level of effect can be refined to the API, and each API can be bound to the plug-in or the plug-in can be removed from the API. Apache APISIX can be fine-grained to control the observable data collection for each API in each service. In other words, you can collect only the data you care about most, and these configurations are dynamically in effect and can be adjusted at any time.
Active Community#
One of the most important advantages of Apache APISIX is that there is an active community, and an active community allows the product to iterate quickly, get better and better, and get everyone's needs met.
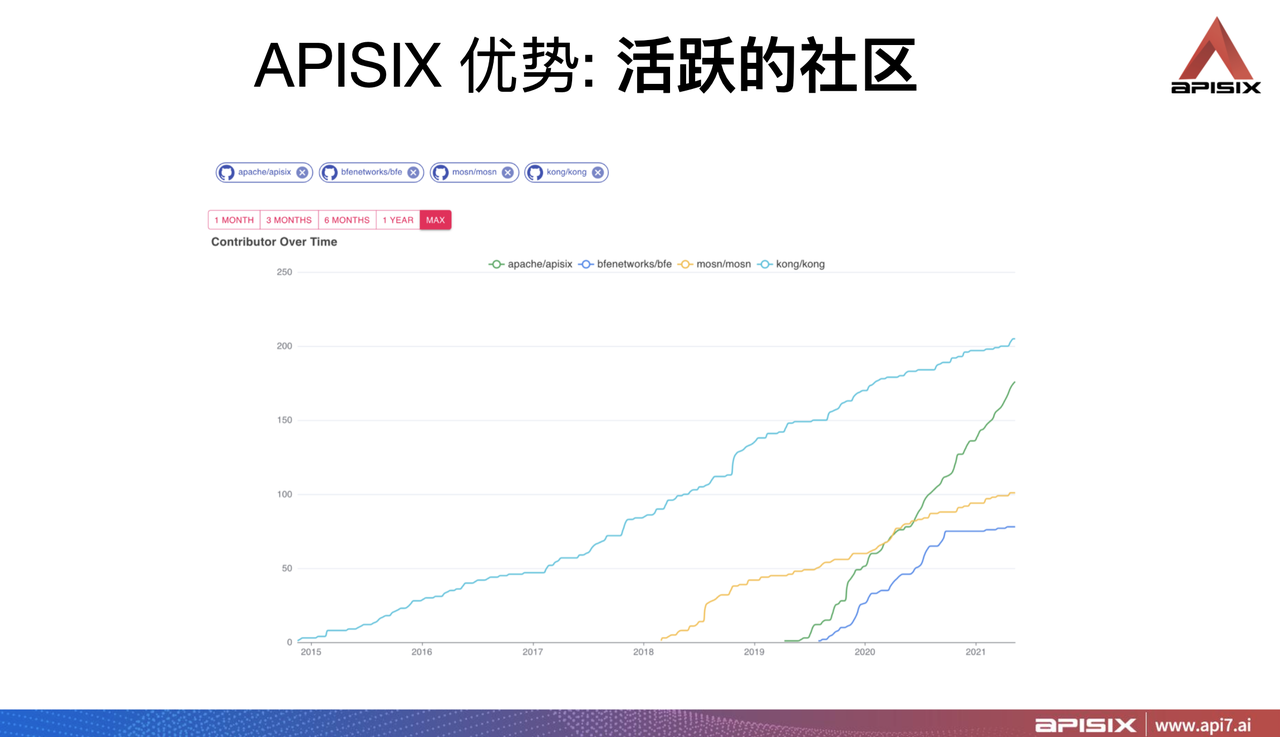
The graph above shows the growth curves of Apache APISIX (green), Kong (light blue), mosn (yellow), and bfe (dark blue) contributors, with Apache APISX showing the fastest growth trend and the steepest curve. Apache APISIX community activity is the most active within its category.
Combining Apache SkyWalking for further improvements in observability#
What enhancements can be made by combining Apache APISIX with Apache SkyWalking? In addition to the SkyWalking tracing plugin, you can also aggregate tracing, metrics, logging, and events into SkyWalking, and use SkyWalking's aggregation capabilities to link data.
SkyWalking Satellite#
SkyWalking Satellite is developed by the Apache APISIX community, the Apache SkyWalking community, and Baidu in deep cooperation.
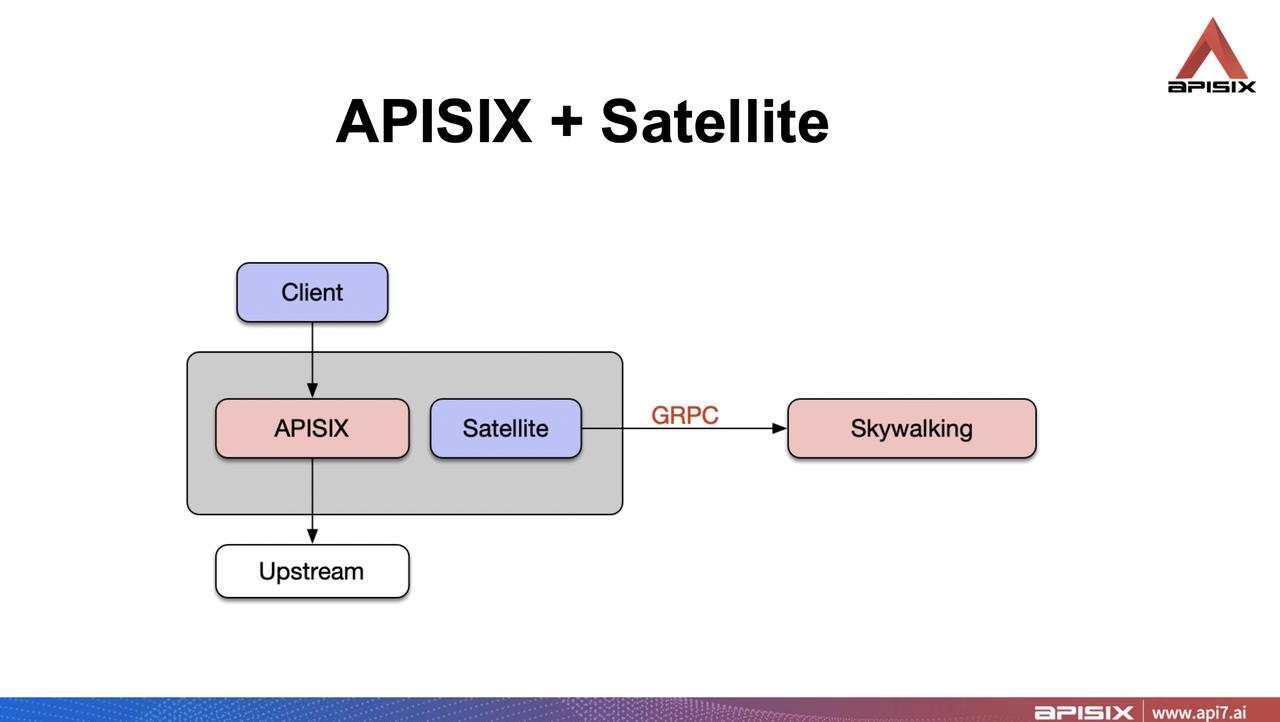
SkyWalking Satellite follows the steps in the above diagram to collect data. SkyWalking Satellite can be deployed closer to the front-end where the data is generated, in the form of a sidecar.
In the diagram from top to bottom business requests go through Apache APISIX proxy to Upstream, Satellite is deployed next to Apache APISIX in the form of sidecar to collect data from Apache APISIX in three data types: tracing, metrics and logging, and send it to SkyWalking via GRPC protocol.
The most important point is that in this deployment method, Apache APISIX can integrate the three data types directly into SkyWalking without making any changes.
ALS Solution#
ALS (Access Log Service) sends out access logs from Apache APISIX, adding special fields to the normal access log, e.g., adding key fields to facilitate topology map generation and aggregating metrics.
The biggest advantage of ALS solution is that it can directly analyze and aggregate three types of data, such as topology, metrics, and logging, by means of access log. When using Prometheus, if you configure the statistics of metrics at the URI level, the whole metrics will be inflated dramatically. Because there may be dozens of services at the URI level, each metrics may be followed by many labels, which will slow down the performance of the gateway and make the metrics more difficult to obtain. Use ALS solution to send the data to SkyWalking by streaming, leaving the calculation to SkyWalking and making it easy to query later, without pulling very large data every few seconds.
Integrating Events into SkyWalking#
Commonly used Events include: configuration distribution, cluster changes, and health checks.
Configuration Distribution: When configuring API distribution, routes may be added, routes modified, routes removed, or plugins added.
Cluster Changes: When the cluster changes, you need to know the number of services in the cluster. For example, IPs change during expansion, and the changes are reflected when the gateway receives the message. Each process is an event, and these events need to be exposed.
Health Check: Proactive detection of health, e.g., business request failure rate suddenly becomes high, and events detect unhealthy business services, at which point the problem can be quickly located.
Extended Reading#
How the extension mechanism of Apache APISIX is implemented and its impact on stability#
Question: How is the extension mechanism of Apache APISIX implemented? Does extending this feature have an impact on the stability of Apache APISIX itself?
A: The Apache APISIX extension mechanism benefits from its architecture, which allows adding business logic to each phase (rewrite / access / header_filter / body_filter / preread_filter / log).
As for stability, Apache APISIX has open sourced nearly 50 plugins, each of which is tested end-to-end and is proven to be stable and available. However, custom plug-ins have to follow certain specifications, which are simple, but we should not be too casual. The stability of the custom plug-ins is guaranteed and needs to be guaranteed by the business side itself.
How to confirm that rules are in effect#
Q: Nginx may have a lot of rules configured in the nginx.conf file, and the later rules may be blocked by the earlier rules, so it is not clear if the later rules are in effect.
A: The more configuration you have in the nginx.conf file, and the more complex the configuration service, the more difficult it is to maintain this file. But in Apache APISIX, the configuration file is fixed, and the official Apache APISIX configuration is the optimal configuration for most scenarios, while other routing configurations are configured in the API, and the routing configuration is in memory.
In terms of management, you can manage your routes in a variety of organizational ways, for example, through the Dashboard.
For example, if you have a service called ABC, you can have various route definitions under this service, and the route definitions can be viewed in a list. Another way to view routes is to tag the API in the dashboard, which makes the management of routes more user-friendly and makes it easy to query the list of routes by tag filtering.
About the Author#
Wei Jin, Apache APISIX PMC and Apache SkyWalking committer.