prometheus
This plugin exposes metrics in Prometheus Exposition format.
Attributes#
none.
API#
This plugin will add /apisix/prometheus/metrics to expose the metrics.
You may need to use interceptors to protect it.
How to enable it#
prometheus plugin can be enable with empty table, because it doesn't have
any options yet.
For example:
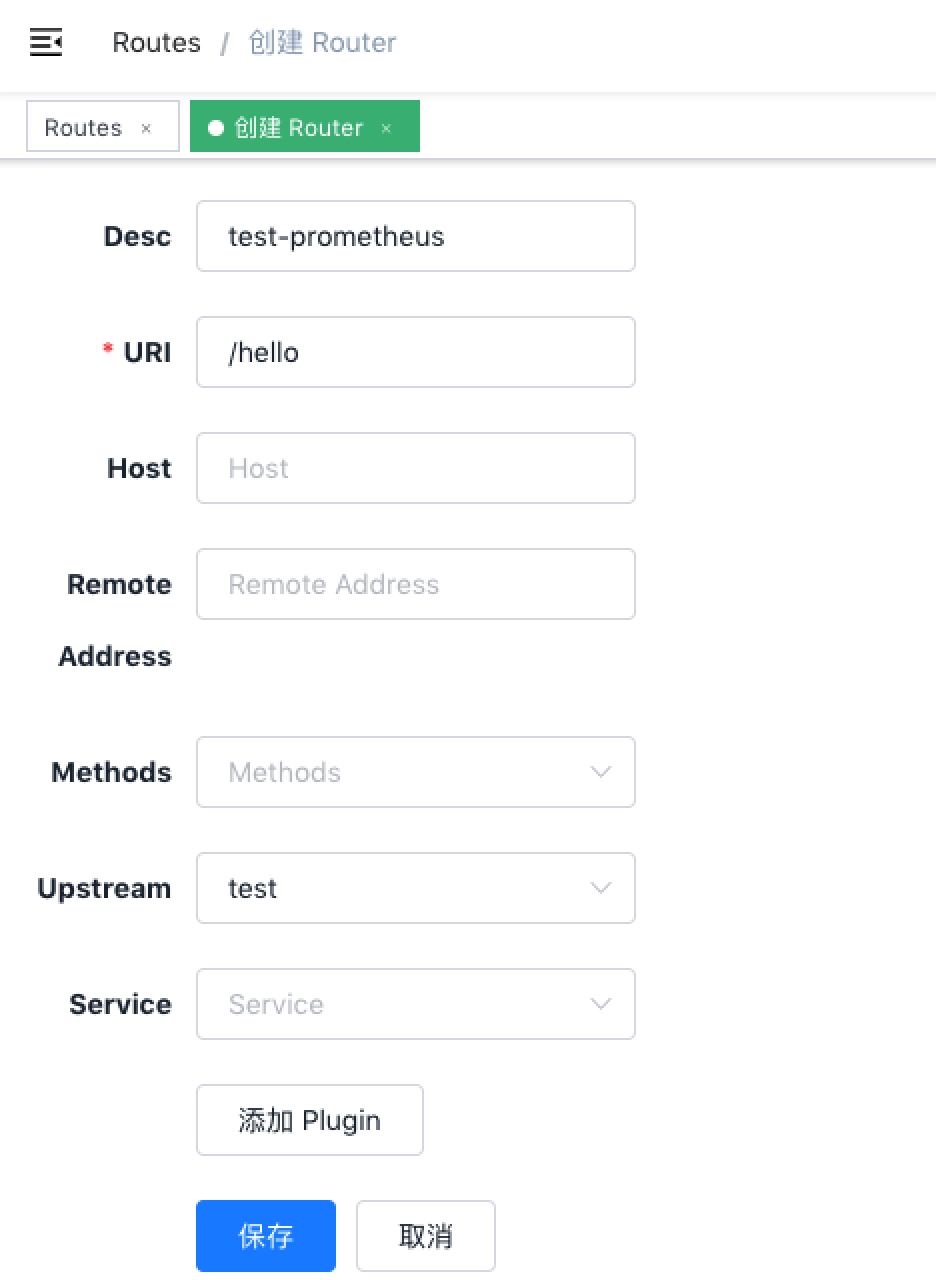
curl http://127.0.0.1:9080/apisix/admin/routes/1 -H 'X-API-KEY: edd1c9f034335f136f87ad84b625c8f1' -X PUT -d '{ "uri": "/hello", "plugins": { "prometheus":{} }, "upstream": { "type": "roundrobin", "nodes": { "127.0.0.1:80": 1 } }}'You can open dashboard with a browser: http://127.0.0.1:9080/apisix/dashboard/, to complete the above operation through the web interface, first add a route:
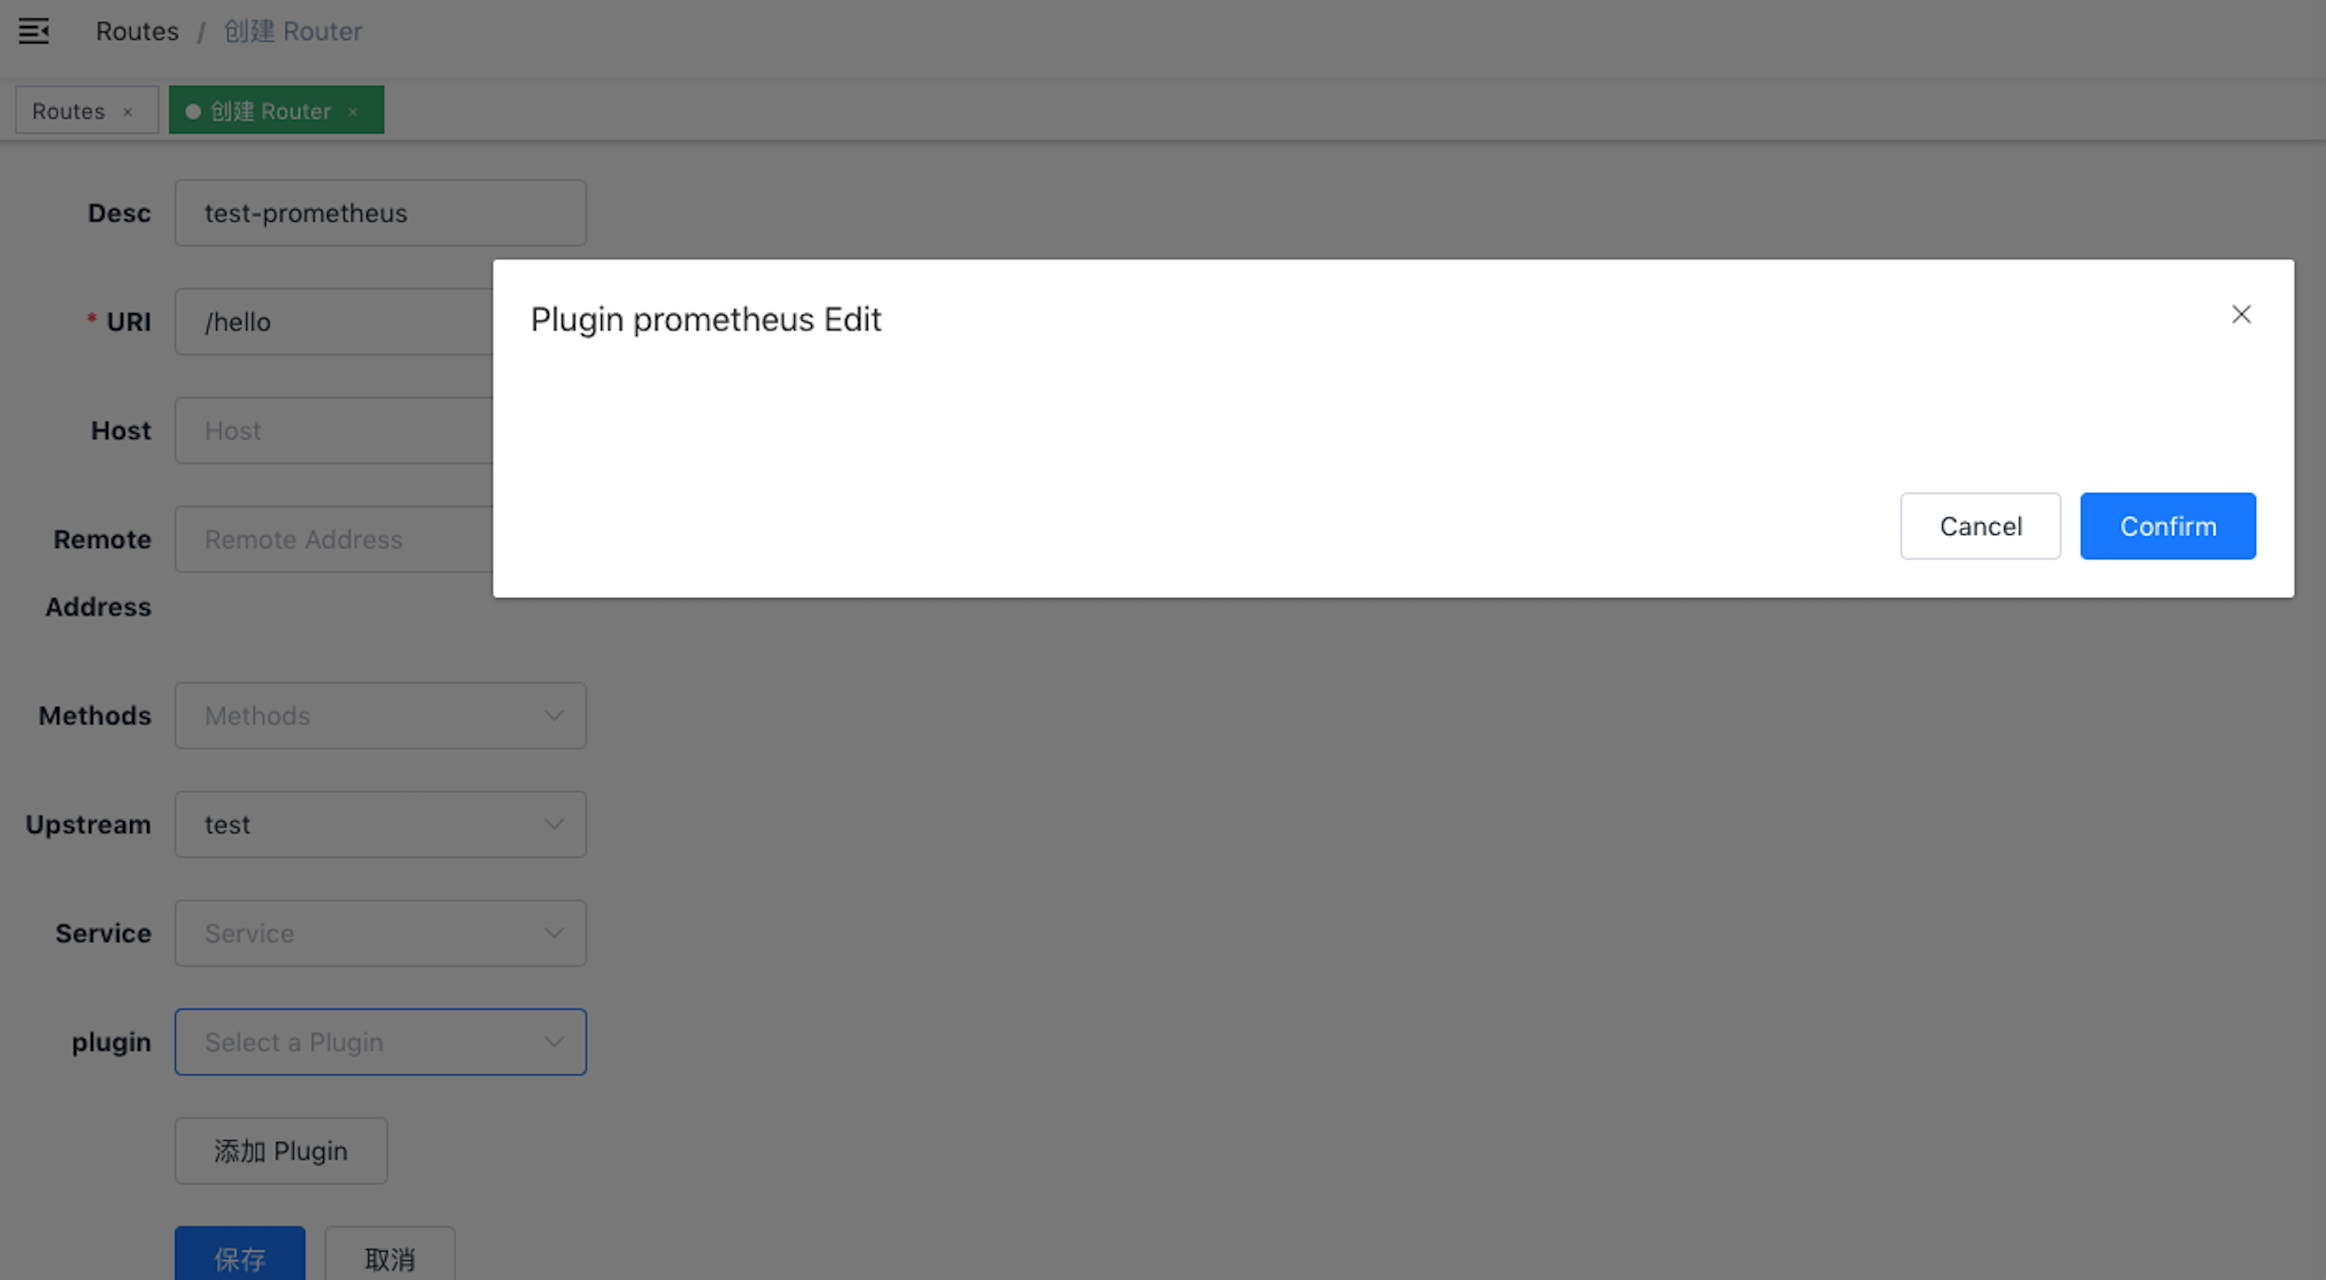
Then add prometheus plugin:
How to fetch the metric data#
We fetch the metric data from the specified url /apisix/prometheus/metrics.
curl -i http://127.0.0.1:9080/apisix/prometheus/metricsPuts this URL address into prometheus, and it will automatically fetch these metric data.
For example like this:
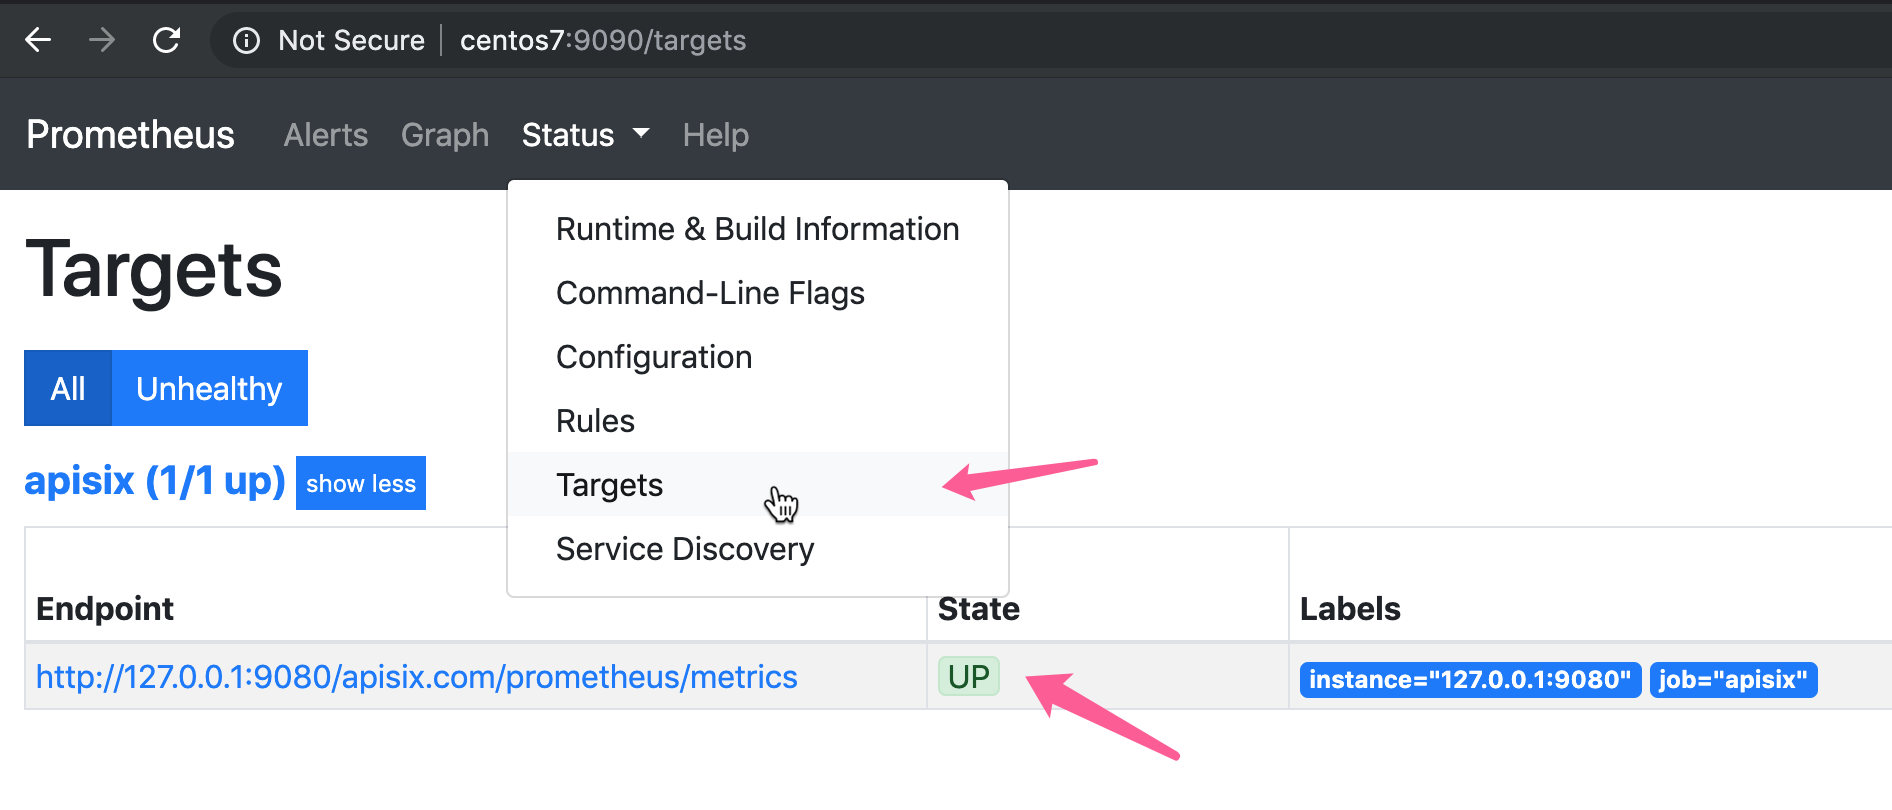
scrape_configs: - job_name: 'apisix' metrics_path: '/apisix/prometheus/metrics' static_configs: - targets: ['127.0.0.1:9080']And we can check the status at prometheus console:
How to specify export uri#
We can change the default export uri in the plugin_attr section of conf/config.yaml.
| Name | Type | Default | Description |
|---|---|---|---|
| export_uri | string | "/apisix/prometheus/metrics" | uri to get the prometheus metrics |
Here is an example:
plugin_attr: prometheus: export_uri: /apisix/metricsGrafana dashboard#
Metrics exported by the plugin can be graphed in Grafana using a drop in dashboard.
Downloads Grafana dashboard meta and imports it to Grafana。
Or you can goto Grafana official for Grafana meta data.
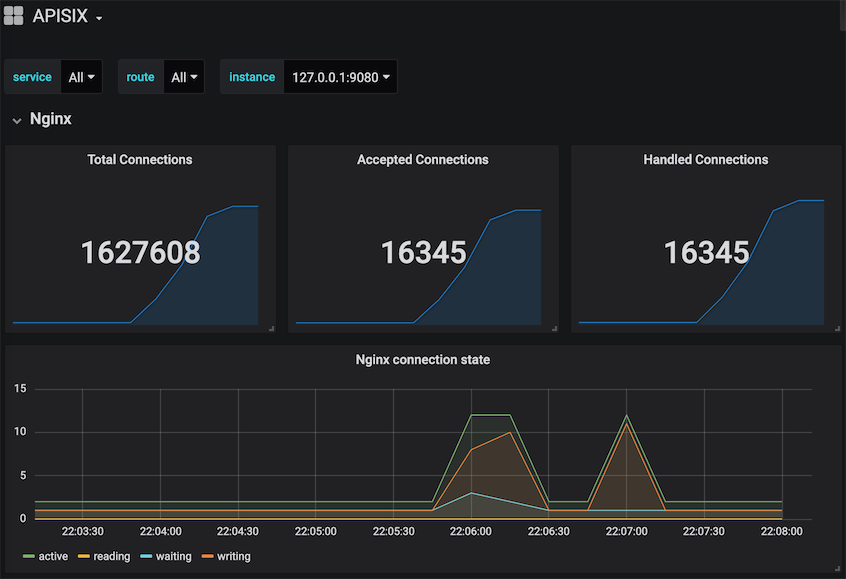

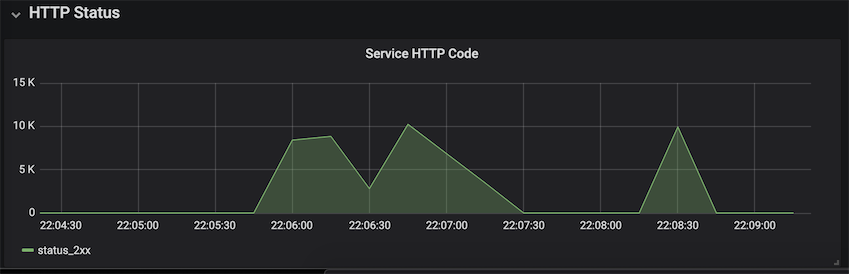
Available metrics#
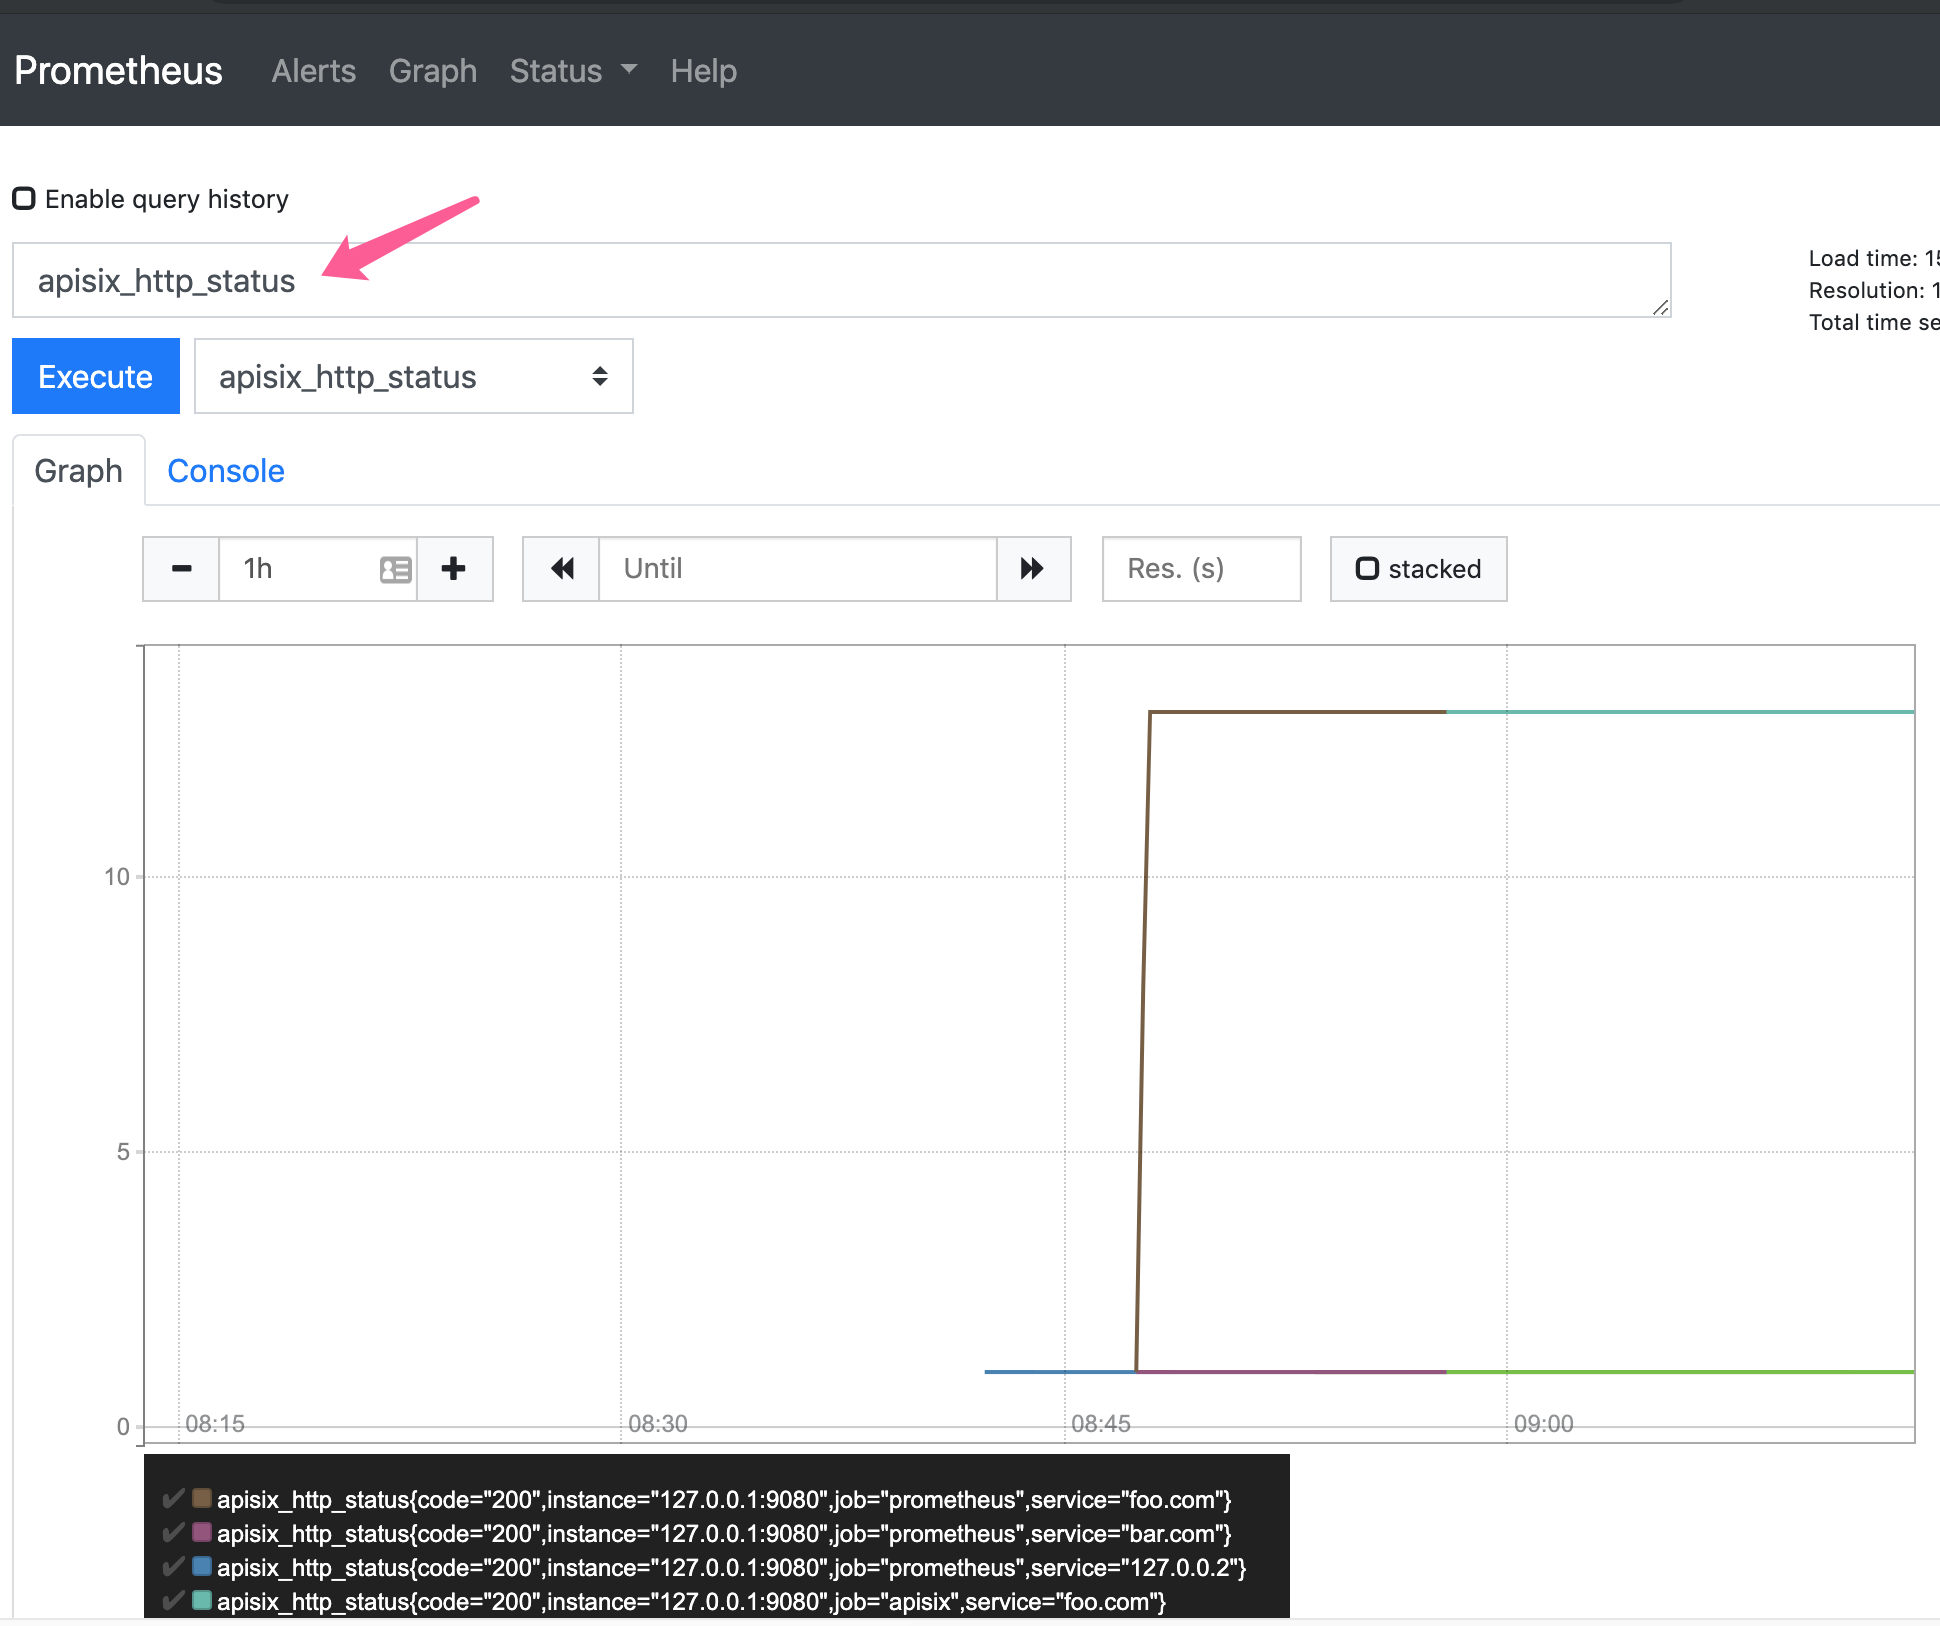
Status codes: HTTP status codes returned by upstream services. These are available per service and across all services.Bandwidth: Total Bandwidth (egress/ingress) flowing through apisix. This metric is available per service and as a sum across all services.etcd reachability: A gauge type with a value of 0 or 1, representing if etcd can be reached by a apisix or not.Connections: Various Nginx connection metrics like active, reading, writing, and number of accepted connections.Batch process entries: A gauge type, when we use plugins and the plugin used batch process to send data, such as: sys logger, http logger, sls logger, tcp logger, udp logger and zipkin, then the entries which hasn't been sent in batch process will be counted in the metrics.Latency: The per service histogram of request time and the overhead added by APISIX (request time - upstream response time).Info: the information of APISIX node.
Here is the original metric data of apisix:
$ curl http://127.0.0.1:9080/apisix/prometheus/metrics# HELP apisix_bandwidth Total bandwidth in bytes consumed per service in Apisix# TYPE apisix_bandwidth counterapisix_bandwidth{type="egress",service="127.0.0.2"} 183apisix_bandwidth{type="egress",service="bar.com"} 183apisix_bandwidth{type="egress",service="foo.com"} 2379apisix_bandwidth{type="ingress",service="127.0.0.2"} 83apisix_bandwidth{type="ingress",service="bar.com"} 76apisix_bandwidth{type="ingress",service="foo.com"} 988# HELP apisix_etcd_modify_indexes Etcd modify index for APISIX keys# TYPE apisix_etcd_modify_indexes gaugeapisix_etcd_modify_indexes{key="consumers"} 0apisix_etcd_modify_indexes{key="global_rules"} 0apisix_etcd_modify_indexes{key="max_modify_index"} 222apisix_etcd_modify_indexes{key="prev_index"} 35apisix_etcd_modify_indexes{key="protos"} 0apisix_etcd_modify_indexes{key="routes"} 222apisix_etcd_modify_indexes{key="services"} 0apisix_etcd_modify_indexes{key="ssls"} 0apisix_etcd_modify_indexes{key="stream_routes"} 0apisix_etcd_modify_indexes{key="upstreams"} 0apisix_etcd_modify_indexes{key="x_etcd_index"} 223# HELP apisix_batch_process_entries batch process remaining entries# TYPE apisix_batch_process_entries gaugeapisix_batch_process_entries{name="http-logger",route_id="9",server_addr="127.0.0.1"} 1apisix_batch_process_entries{name="sls-logger",route_id="9",server_addr="127.0.0.1"} 1apisix_batch_process_entries{name="tcp-logger",route_id="9",server_addr="127.0.0.1"} 1apisix_batch_process_entries{name="udp-logger",route_id="9",server_addr="127.0.0.1"} 1apisix_batch_process_entries{name="sys-logger",route_id="9",server_addr="127.0.0.1"} 1apisix_batch_process_entries{name="zipkin_report",route_id="9",server_addr="127.0.0.1"} 1# HELP apisix_etcd_reachable Config server etcd reachable from Apisix, 0 is unreachable# TYPE apisix_etcd_reachable gaugeapisix_etcd_reachable 1# HELP apisix_http_status HTTP status codes per service in Apisix# TYPE apisix_http_status counterapisix_http_status{code="200",service="127.0.0.2"} 1apisix_http_status{code="200",service="bar.com"} 1apisix_http_status{code="200",service="foo.com"} 13# HELP apisix_nginx_http_current_connections Number of HTTP connections# TYPE apisix_nginx_http_current_connections gaugeapisix_nginx_http_current_connections{state="accepted"} 11994apisix_nginx_http_current_connections{state="active"} 2apisix_nginx_http_current_connections{state="handled"} 11994apisix_nginx_http_current_connections{state="reading"} 0apisix_nginx_http_current_connections{state="total"} 1191780apisix_nginx_http_current_connections{state="waiting"} 1apisix_nginx_http_current_connections{state="writing"} 1# HELP apisix_nginx_metric_errors_total Number of nginx-lua-prometheus errors# TYPE apisix_nginx_metric_errors_total counterapisix_nginx_metric_errors_total 0# HELP apisix_http_latency HTTP request latency in milliseconds per service in APISIX# TYPE apisix_http_latency histogramapisix_http_latency_bucket{type="request",service="",consumer="",node="127.0.0.1",le="00001.0"} 1apisix_http_latency_bucket{type="request",service="",consumer="",node="127.0.0.1",le="00002.0"} 1...# HELP apisix_http_overhead HTTP request overhead added by APISIX in milliseconds per service in APISIX# TYPE apisix_http_overhead histogramapisix_http_overhead_bucket{type="request",service="",consumer="",node="127.0.0.1",le="00001.0"} 1apisix_http_overhead_bucket{type="request",service="",consumer="",node="127.0.0.1",le="00002.0"} 1...# HELP apisix_node_info Info of APISIX node# TYPE apisix_node_info gaugeapisix_node_info{hostname="desktop-2022q8f-wsl"} 1Disable Plugin#
Remove the corresponding json configuration in the plugin configuration to disable prometheus.
APISIX plugins are hot-reloaded, therefore no need to restart APISIX.
curl http://127.0.0.1:9080/apisix/admin/routes/1 -H 'X-API-KEY: edd1c9f034335f136f87ad84b625c8f1' -X PUT -d '{ "uri": "/hello", "plugins": {}, "upstream": { "type": "roundrobin", "nodes": { "127.0.0.1:80": 1 } }}'