prometheus
此插件是提供符合 prometheus 数据格式的监控指标数据。
属性#
无
接口#
插件会增加 /apisix/prometheus/metrics 这个接口,你可能需要通过 interceptors
来保护它。
如何开启插件#
prometheus 插件用空{}就可以开启了,他没有任何的选项。
例子如下:
curl http://127.0.0.1:9080/apisix/admin/routes/1 -H 'X-API-KEY: edd1c9f034335f136f87ad84b625c8f1' -X PUT -d '{ "uri": "/hello", "plugins": { "prometheus":{} }, "upstream": { "type": "roundrobin", "nodes": { "127.0.0.1:80": 1 } }}'你可以使用浏览器打开 dashboard:http://127.0.0.1:9080/apisix/dashboard/,通过 web 界面来完成上面的操作,先增加一个 route:
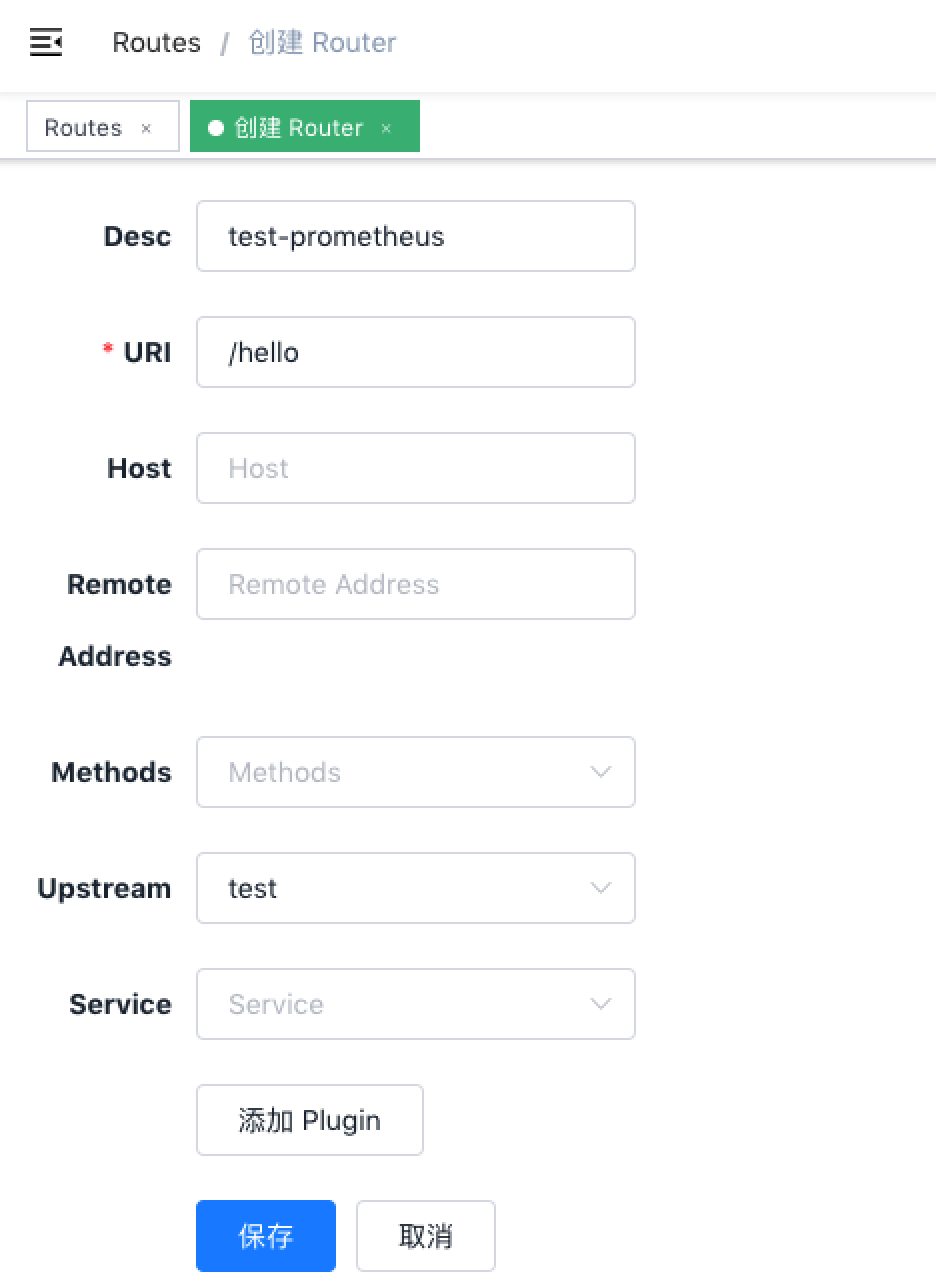
然后在 route 页面中添加 prometheus 插件:

如何提取指标数据#
我们可以从指定的 url 中提取指标数据 /apisix/prometheus/metrics:
curl -i http://127.0.0.1:9080/apisix/prometheus/metrics把该 uri 地址配置到 prometheus 中去,就会自动完成指标数据提取.
例子如下:
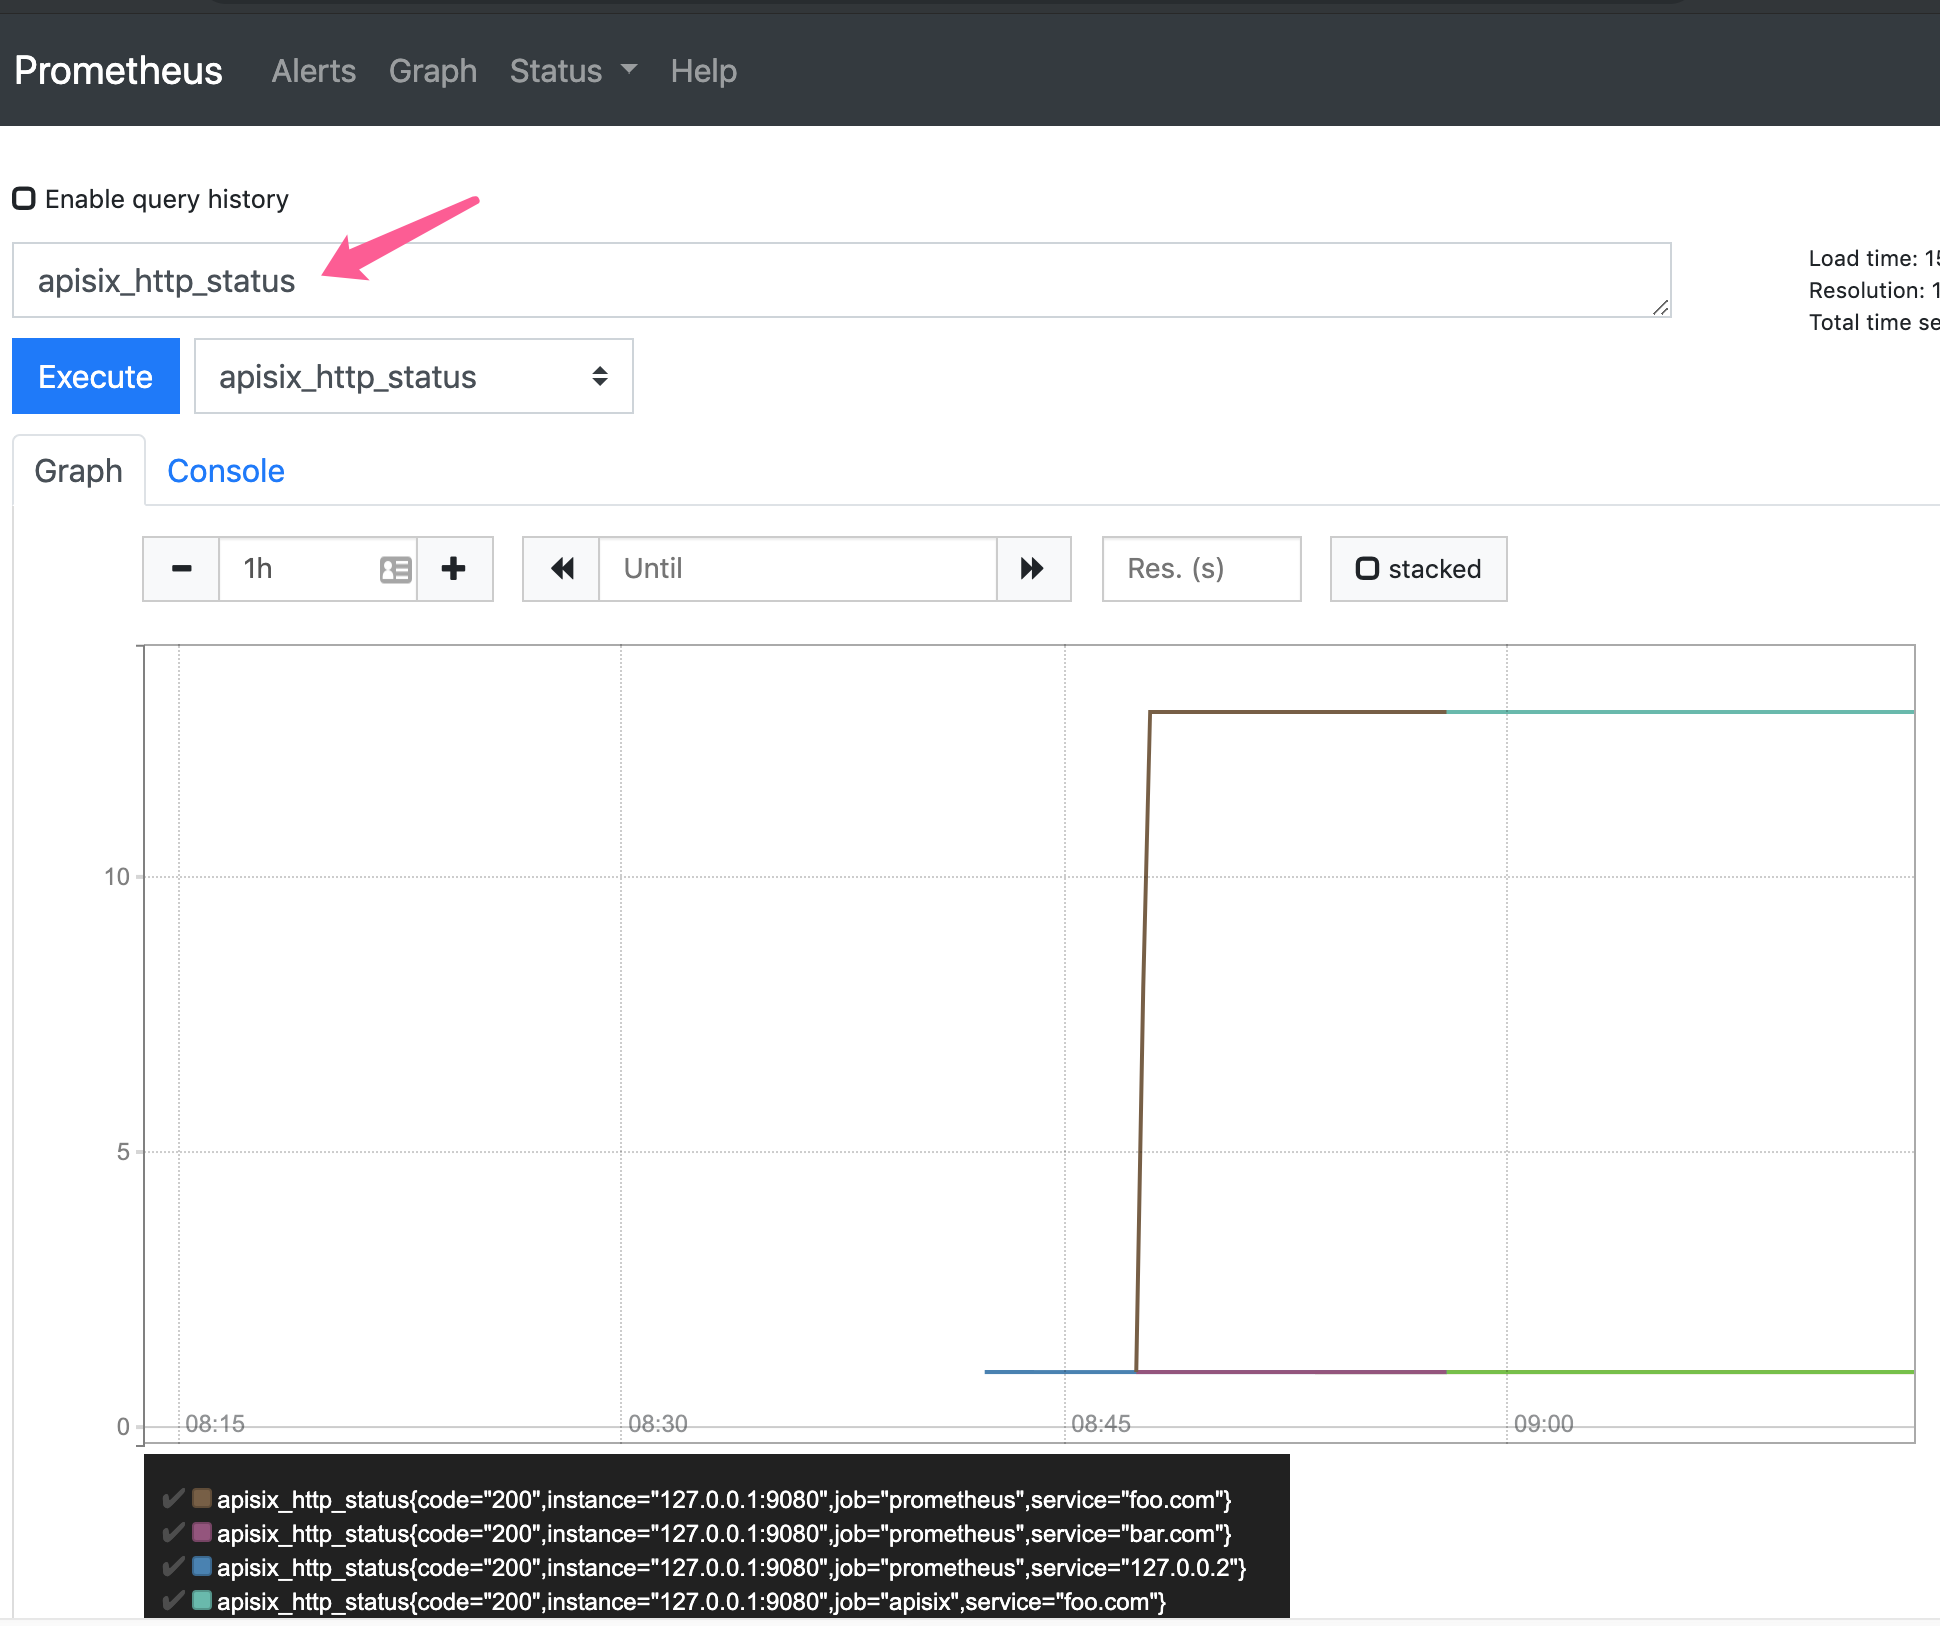
scrape_configs: - job_name: "apisix" metrics_path: "/apisix/prometheus/metrics" static_configs: - targets: ["127.0.0.1:9080"]我们也可以在 prometheus 控制台中去检查状态:

如何修改暴露指标的 uri#
我们可以在 conf/config.yaml 的 plugin_attr 修改默认的 uri
| 名称 | 类型 | 默认值 | 描述 |
|---|---|---|---|
| export_uri | string | "/apisix/prometheus/metrics" | 暴露指标的 uri |
配置示例:
plugin_attr: prometheus: export_uri: /apisix/metricsGrafana 面板#
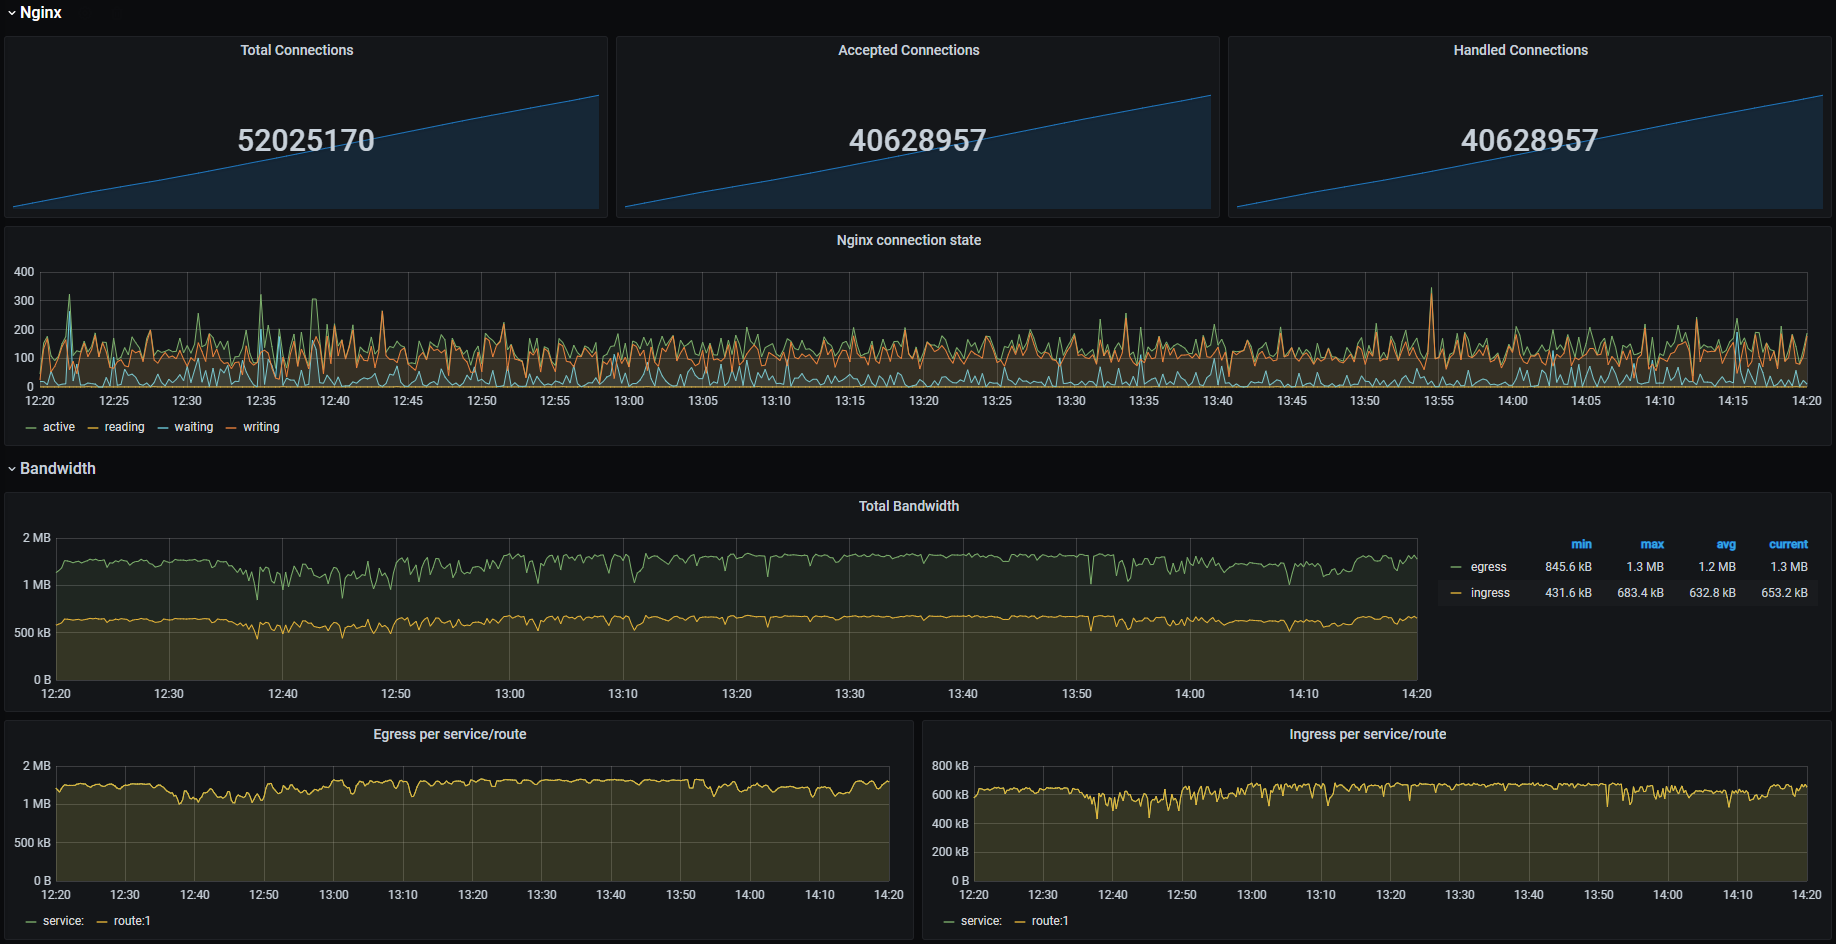
插件导出的指标可以在 Grafana 进行图形化绘制显示。
下载 Grafana dashboard 元数据 并导入到 Grafana 中。
你可以到 Grafana 官方 下载 Grafana 元数据.


可有的指标#
Status codes: upstream 服务返回的 HTTP 状态码,可以统计到每个服务或所有服务的响应状态码的次数总和。具有的维度:名称 描述 code upstream 服务返回的 HTTP 状态码。 route 请求匹配的 route 的 route_id,未匹配,则默认为空字符串。matched_uri 请求匹配的 route 的 uri,未匹配,则默认为空字符串。matched_host 请求匹配的 route 的 host,未匹配,则默认为空字符串。service 与请求匹配的 route 的 service_id。当路由缺少 service_id 时,则默认为$host。consumer 与请求匹配的 consumer 的 consumer_name。未匹配,则默认为空字符串。node 命中的 upstream 节点 ip。Bandwidth: 流经 APISIX 的总带宽(可分出口带宽和入口带宽),可以统计到每个服务的带宽总和。具有的维度:名称 描述 type 带宽的类型( ingress或egress)。route 请求匹配的 route 的 route_id,未匹配,则默认为空字符串。service 与请求匹配的 route 的 service_id。当路由缺少 service_id 时,则默认为$host。consumer 与请求匹配的 consumer 的 consumer_name。未匹配,则默认为空字符串。node 命中的 upstream 节点 ip。etcd reachability: APISIX 连接 etcd 的可用性,用 0 和 1 来表示,1表示可用,0表示不可用。Connections: 各种的 Nginx 连接指标,如 active(正处理的活动连接数),reading(nginx 读取到客户端的 Header 信息数),writing(nginx 返回给客户端的 Header 信息数),已建立的连接数。Batch process entries: 批处理未发送数据计数器,当你使用了批处理发送插件,比如:sys logger, http logger, sls logger, tcp logger, udp logger and zipkin, 那么你将会在此指标中看到批处理当前尚未发送的数据的数量。Latency: 每个服务的请求用时和 APISIX 处理耗时的直方图。具有的维度:名称 描述 type 它的值固定为 request,表示 HTTP 请求。service 与请求匹配的 route 的 service_id。当路由缺少 service_id 时,则默认为$host。consumer 与请求匹配的 consumer 的 consumer_name。未匹配,则默认为空字符串。node 命中的 upstream 节点 ip。Overhead: 每个服务在 APISIX 中的请求开销(以毫秒为单位)。具有的维度:名称 描述 type 它的值固定为 request,表示 HTTP 请求。service 与请求匹配的 route 的 service_id。当路由缺少 service_id 时,则默认为$host。consumer 与请求匹配的 consumer 的 consumer_name。未匹配,则默认为空字符串。node 命中的 upstream 节点 ip。Info: 当前 APISIX 节点信息。
这里是 APISIX 的原始的指标数据集:
$ curl http://127.0.0.2:9080/apisix/prometheus/metrics# HELP apisix_bandwidth Total bandwidth in bytes consumed per service in Apisix# TYPE apisix_bandwidth counterapisix_bandwidth{type="egress",route="",service="127.0.0.1",consumer="",node=""} 8417apisix_bandwidth{type="egress",route="1",service="",consumer="",node="127.0.0.1"} 1420apisix_bandwidth{type="egress",route="2",service="",consumer="",node="127.0.0.1"} 1420apisix_bandwidth{type="ingress",route="",service="127.0.0.1",consumer="",node=""} 189apisix_bandwidth{type="ingress",route="1",service="",consumer="",node="127.0.0.1"} 332apisix_bandwidth{type="ingress",route="2",service="",consumer="",node="127.0.0.1"} 332# HELP apisix_etcd_modify_indexes Etcd modify index for APISIX keys# TYPE apisix_etcd_modify_indexes gaugeapisix_etcd_modify_indexes{key="consumers"} 0apisix_etcd_modify_indexes{key="global_rules"} 0apisix_etcd_modify_indexes{key="max_modify_index"} 222apisix_etcd_modify_indexes{key="prev_index"} 35apisix_etcd_modify_indexes{key="protos"} 0apisix_etcd_modify_indexes{key="routes"} 222apisix_etcd_modify_indexes{key="services"} 0apisix_etcd_modify_indexes{key="ssls"} 0apisix_etcd_modify_indexes{key="stream_routes"} 0apisix_etcd_modify_indexes{key="upstreams"} 0apisix_etcd_modify_indexes{key="x_etcd_index"} 223# HELP apisix_batch_process_entries batch process remaining entries# TYPE apisix_batch_process_entries gaugeapisix_batch_process_entries{name="http-logger",route_id="9",server_addr="127.0.0.1"} 1apisix_batch_process_entries{name="sls-logger",route_id="9",server_addr="127.0.0.1"} 1apisix_batch_process_entries{name="tcp-logger",route_id="9",server_addr="127.0.0.1"} 1apisix_batch_process_entries{name="udp-logger",route_id="9",server_addr="127.0.0.1"} 1apisix_batch_process_entries{name="sys-logger",route_id="9",server_addr="127.0.0.1"} 1apisix_batch_process_entries{name="zipkin_report",route_id="9",server_addr="127.0.0.1"} 1# HELP apisix_etcd_reachable Config server etcd reachable from Apisix, 0 is unreachable# TYPE apisix_etcd_reachable gaugeapisix_etcd_reachable 1# HELP apisix_http_status HTTP status codes per service in Apisix# TYPE apisix_http_status counterapisix_http_status{code="200",route="1",matched_uri="/hello",matched_host="",service="127.0.0.2",consumer="",node="127.0.0.1"} 4apisix_http_status{code="200",route="2",matched_uri="/world",matched_host="",service="bar.com",consumer="",node="127.0.0.1"} 4apisix_http_status{code="404",route="",matched_uri="",matched_host="",service="127.0.0.1",consumer="",node=""} 1# HELP apisix_nginx_http_current_connections Number of HTTP connections# TYPE apisix_nginx_http_current_connections gaugeapisix_nginx_http_current_connections{state="accepted"} 11994apisix_nginx_http_current_connections{state="active"} 2apisix_nginx_http_current_connections{state="handled"} 11994apisix_nginx_http_current_connections{state="reading"} 0apisix_nginx_http_current_connections{state="total"} 1191780apisix_nginx_http_current_connections{state="waiting"} 1apisix_nginx_http_current_connections{state="writing"} 1# HELP apisix_nginx_metric_errors_total Number of nginx-lua-prometheus errors# TYPE apisix_nginx_metric_errors_total counterapisix_nginx_metric_errors_total 0# HELP apisix_http_latency HTTP request latency in milliseconds per service in APISIX# TYPE apisix_http_latency histogramapisix_http_latency_bucket{type="request",service="",consumer="",node="127.0.0.1",le="1"} 1apisix_http_latency_bucket{type="request",service="",consumer="",node="127.0.0.1",le="2"} 1...# HELP apisix_http_overhead HTTP request overhead added by APISIX in milliseconds per service in APISIX# TYPE apisix_http_overhead histogramapisix_http_overhead_bucket{type="request",service="",consumer="",node="127.0.0.1",le="1"} 1apisix_http_overhead_bucket{type="request",service="",consumer="",node="127.0.0.1",le="2"} 1...# HELP apisix_node_info Info of APISIX node# TYPE apisix_node_info gaugeapisix_node_info{hostname="desktop-2022q8f-wsl"} 1禁用插件#
在插件设置页面中删除相应的 json 配置即可禁用 prometheus 插件。APISIX 的插件是热加载的,因此无需重启 APISIX 服务。
curl http://127.0.0.1:9080/apisix/admin/routes/1 -H 'X-API-KEY: edd1c9f034335f136f87ad84b625c8f1' -X PUT -d '{ "uri": "/hello", "plugins": {}, "upstream": { "type": "roundrobin", "nodes": { "127.0.0.1:80": 1 } }}'